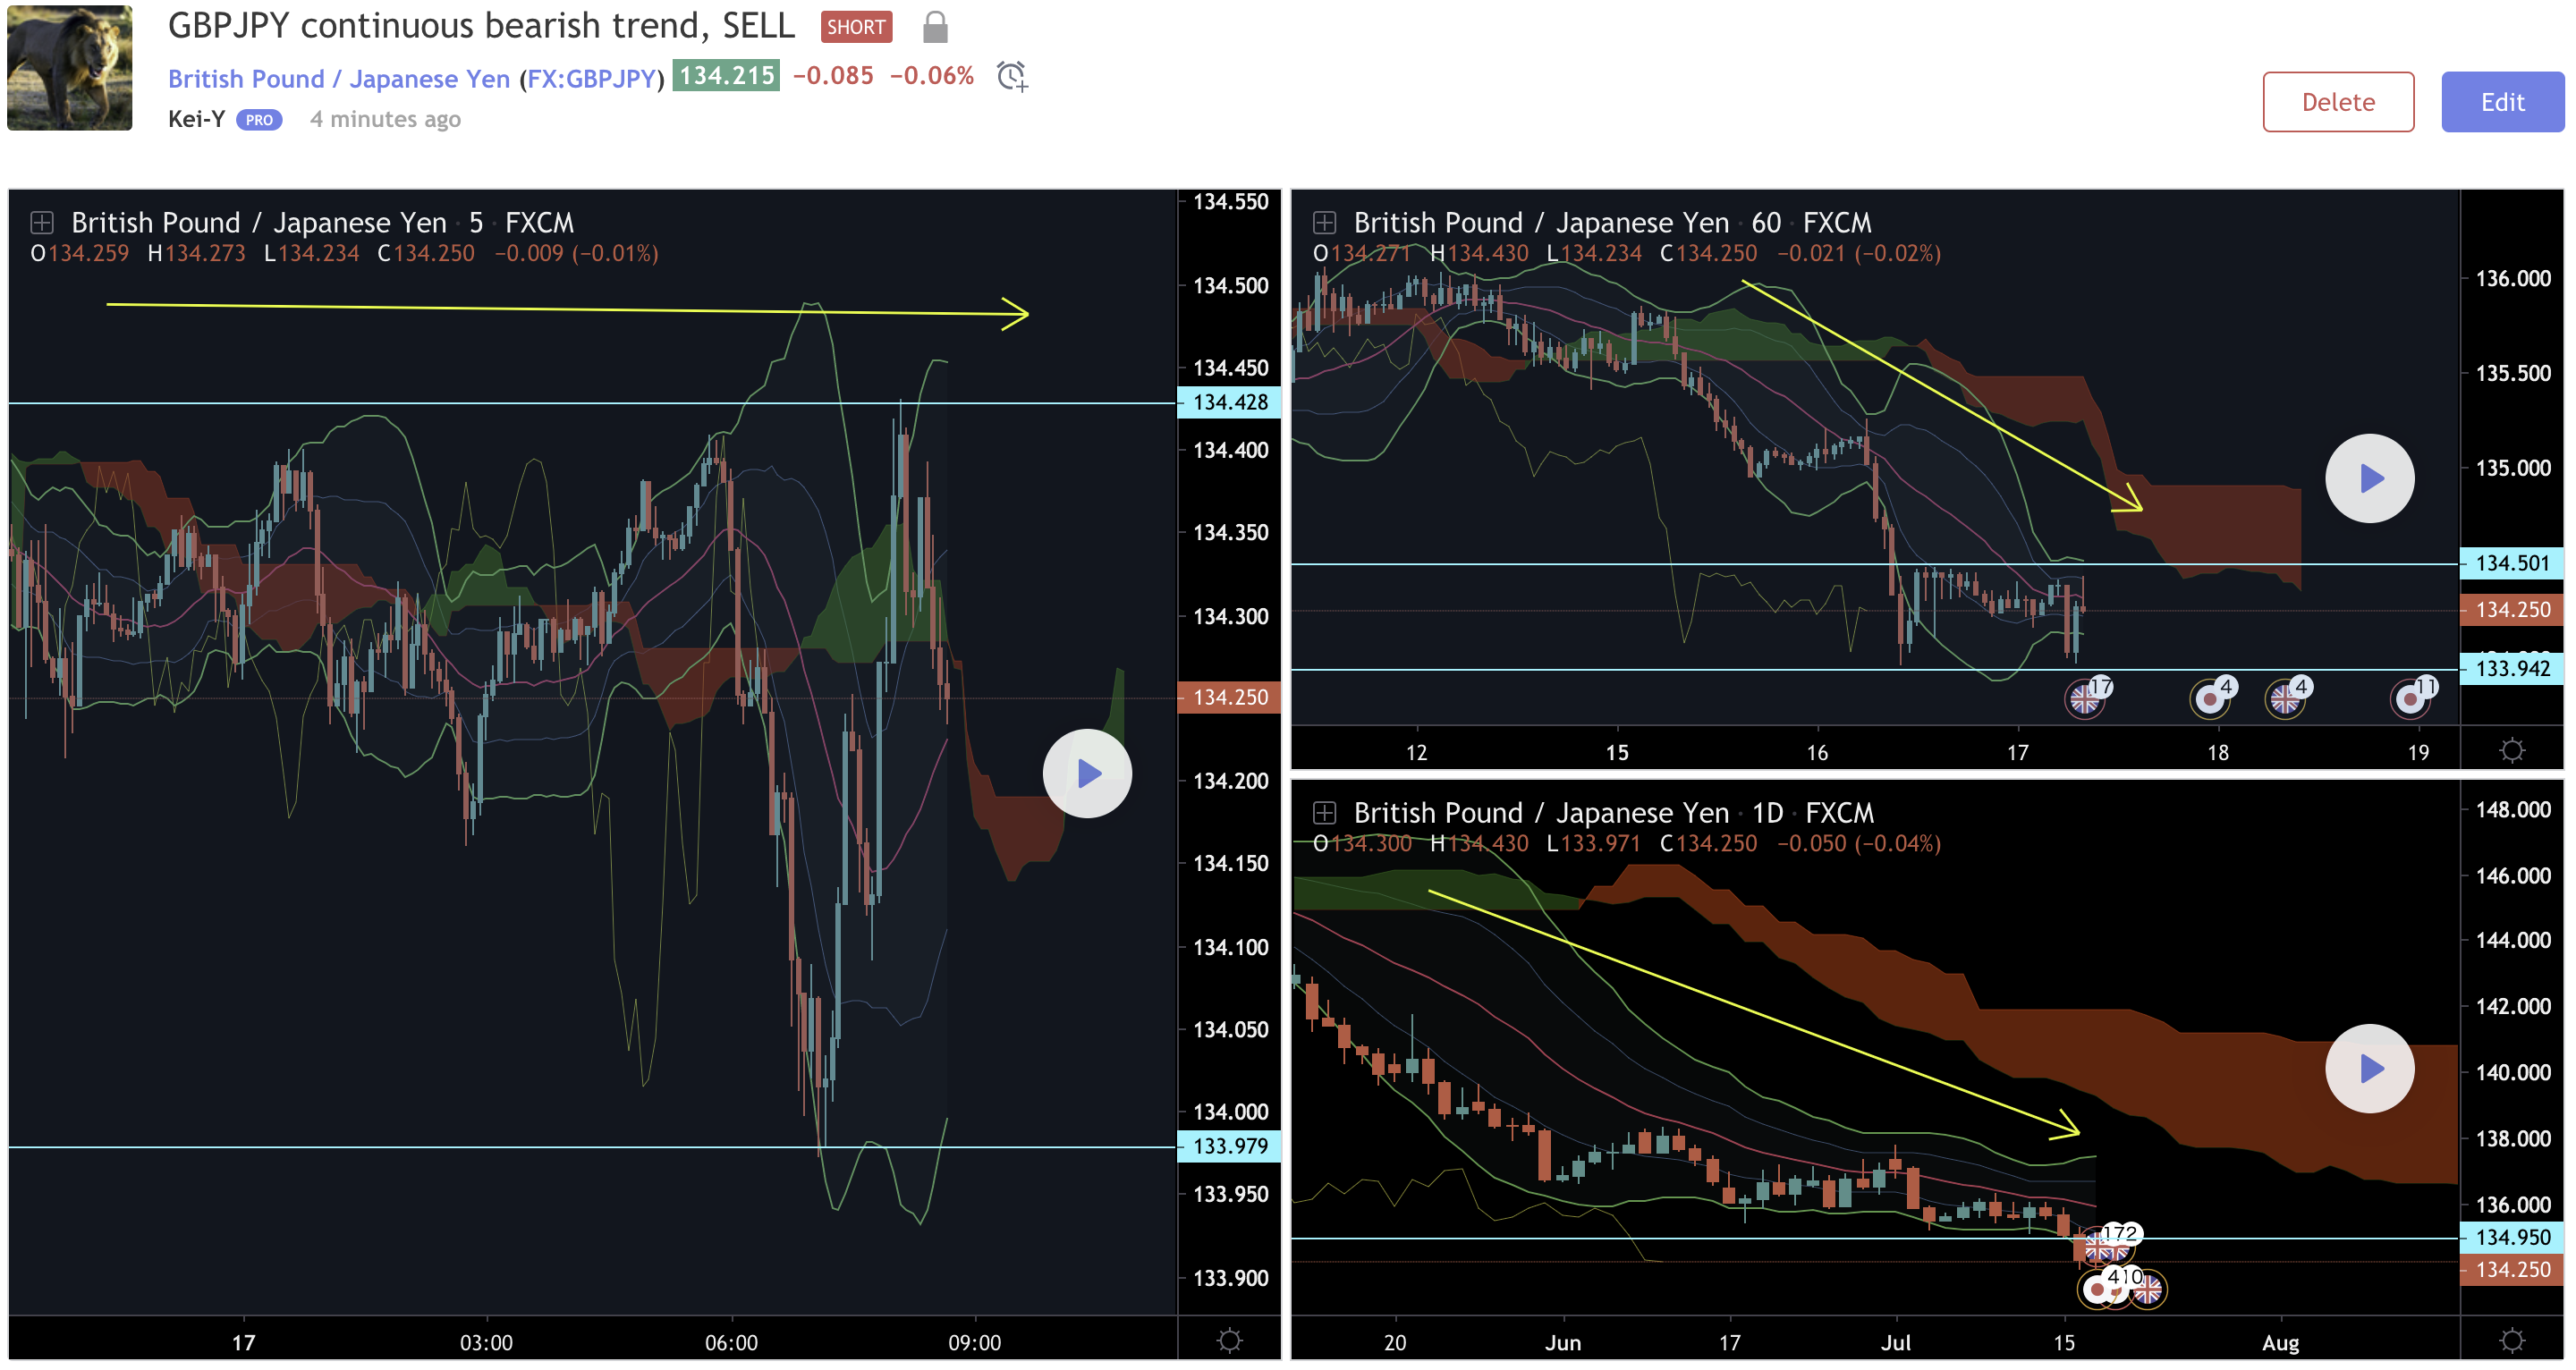
TAG forex

Mental Techniques

How to position trades without buy and sell bias (Live Traded)

This is my analysis on EURGBP because first of all, I see it’s a good chance to buy and I will tell you the reason from my own analysis, but today, I wanted to talk about how to see a chart without any bias so that you can always be flexible whether the price goes up or down, because no one can predict the movement in the future. But good traders always make profit over time because they have plans, and those plans are based on “if” questions, like “if the price goes up, then I will do this” or “If the price goes down, I will do that.” things…

Mental Techniques

The Best Forex Books you must read to be a Winning Trader

I will introduce some of the books I highly recommend for your trade improvement as I get requests like from my followers as below, What is your favorite book for forex trading? Which one should I read to improve my trading? So this time, I will introduce my recommended books to be a successful trader, that I think all the traders must read, because these are the books that I read many many times whenever I get into slump or going through tough times. Watch the Video Among dozens of books I’ve read so far, I picked up the ones that I think are necessary to to read when you…

Mental Techniques

How to keep your trade rules based on psychology

Keeping your own trade rule is one of the endless challenges for all traders. And this video is for those who tend to break his own rule and get loss over time. Like the other day, when the market spikes up and down, like the Gold or USDJPY on 13th of August, you know, they spiked more than 100 pips. and I was watching Facebook and twitter afterwards, and I saw one of the traders lost like 10 million dollars by that, but if you set your own rule and keep the rule, then the loss should’ve been kept minimum in such a volatile situation. So how can you keep…

Chart Reading Techniques

Step by step guide to Multiple Timeframe Analysis with running over $20,000 profit!

This is the forex analysis I do on every currency pair I trade, and this is exactly how I make profit each time. If you have ever been fooled by a sudden movement of the price action, this is the video for you. During the recording, there was a spike, but due to multiple timeframe analysis, I was able to deal with it accordingly. Video Request Form Watch the Video Gold Monthly Chart Analysis This is the Gold chart on the 5th of August, 2019 and let’s start from Monthly chart. One thing you need to remember is whenever you try to analyze the chart, always, you know, always start…

Weekly Chart Analysis

How BOJ will make their move on continuously bearish USDJPY

USDJPY Real Time Daily Chart USDJPY Chart by TradingView Technical Analysis for USDJPY by TradingView Strong JPY Recently, JPY has been quite strong. The USDJPY went below 106.00 line downwards on this Monday as a new week started, and went down to 105.79 yen (as of 4:00 UTC on the 5th of August). Last week FOMC decided to cut interest rates by 25 basis points, and then Chairman Mr. Powell warned that he was looking forward to a market rate cut, saying that “this rate cut is not the beginning of a continuous rate cut in the future” and as a result, USD has been repurchased up to 109.30. But…

Mental Techniques

How much do you need to start forex trading?

This article is about account size in trading, like how much amount of money you should trade with. And this is actually a topic I wanted to talk sometime, but I will talk about one of the common misunderstandings of a trader who has small account size. When you read books about trading, often times it says “managing your own account, you know, your own fund is important for trading.” Maybe you’ve seen those statements somewhere before. And today I am not gonna talk about like how many pips the loss cut should be or how many % of loss each trade should be, you know, that’s something that I…

Weekly Chart Analysis

Continuous Interest Rate Decrease leads weak USD

USDJPY Realtime Chart USDJPY Chart by TradingView Technical Analysis for USDJPY by TradingView USD on 108 Rate In the last half of last week, USDJPY, which had previously been held at 108 yen, dropped down to 107 level due to ”dovish talk” of FOMC members like Williams in NY Fed and also due to JPY being bought as a result of US Navy defeating Iranian drone at the Strait of Hormuz in the Middle East. However, on the weekend, USD was bought back as the Nikkei stock filled the decline on the previous day, and also due to interest rate cut seemed to be postponed and as a result, USDJPY has…

Weekly Chart Analysis

GBPJPY continuous bearish trend, SELL

Daily Chart bearish Daily chart shows continuous down trend as follows, Ichimoku Cloud Price is below cloud. Chikou span is below candles. Bollinger bands Price is walking along StdDiv -2 downwards MA20 MA is going downwards and price is below 20SMA. H1 Chart range Ichimoku Cloud Price is below cloud, however, Chikou span is about to interact with candles. Bollinger Bands Current price is right in the middle of StdDivs, so it could go either direction. The bands are contracting, showing the price is charging energy for the next move. MA20 The price could be resisted by the SMA20 and go down. Also, I can see that there’s a resistance…

Weekly Chart Analysis

Interest Rate Decrease leads USD Not Being Bought

USDJPY Real Time Daily Chart USDJPY Chart by TradingView Technical Analysis for USDJPY by TradingView Last week on USDJPY Last week on USDJPY, USD rebounded to 108.99 at one time, but it was pushed back again to the 107 yen level and returned to “the original sheath” without being put on the 109 yen level. The reason for the USD rebounded to 109 rate was because of the positive employee statistics and that’s why USD was bought at a time, but it seems that it was not a move to buy further. FOMC will be held at the end of this month and most likely the interest rate will decrease,…

Chart Reading Techniques

How to read moving average signals to make profit in forex trading

Hello, Konnichiwa! In forex trading or stock trading, moving average is one of the major tools that every trader would know. It’s a very famous indicator. However, do you know what it really tells you? You know when it gold cross, it’s buy or when it dead cross, it’s sell, right? I guess that’s the first thing you will be taught for moving average strategy. But do you know why it works like that? Have you ever thought about it? Let me explain what it really tells you so that you know the true meaning and what message the moving average actually tells you, and you will be able to…