Hello, Konnichiwa!
In forex trading or stock trading, moving average is one of the major tools that every trader would know. It’s a very famous indicator. However, do you know what it really tells you? You know when it gold cross, it’s buy or when it dead cross, it’s sell, right? I guess that’s the first thing you will be taught for moving average strategy. But do you know why it works like that? Have you ever thought about it? Let me explain what it really tells you so that you know the true meaning and what message the moving average actually tells you, and you will be able to read the market properly.
Watch Video
Understanding calculation is a key to understand an indicator
One thing I believe or I am certain is when you try to use the indicator, you must understand why it exists. And you know it by looking at its calculation. You know, moving average is one of the most common tools that any platforms provide and you can instantly show it for free, however, traders tend not think well what it’s really for.
Same as any other indicators, like Bollinger Bands, RSI, Stochastic, MACD, or Ichimoku cloud. Oh, by the way, I am thinking to record a complete guide of Ichimoku cloud as a Japanese trader myself who studied it from the textbook by an original author, so stay tuned for that!
Anyways, in order to know what the indicator is really for, there are 5 steps you want to focus on if you wanna know what it really indicates. And I will explain about moving average by following those steps.
1st step is to know the calculation. then, you understand the meaning of the calculation. Then, based on the calculation, understand what the indicator focuses on within the market, you know, what it really looks at, then, know buy and sell signals by the indicator, then finally, why it’s got an edge when you buy or sell based on the signals.
What you can know about Moving Average by its calculation
So let’s look at the calculation first.
There are some variations of moving average, like exponential moving average, or weighted moving average, but this time I will explain based on simple moving average just to make the story simple.
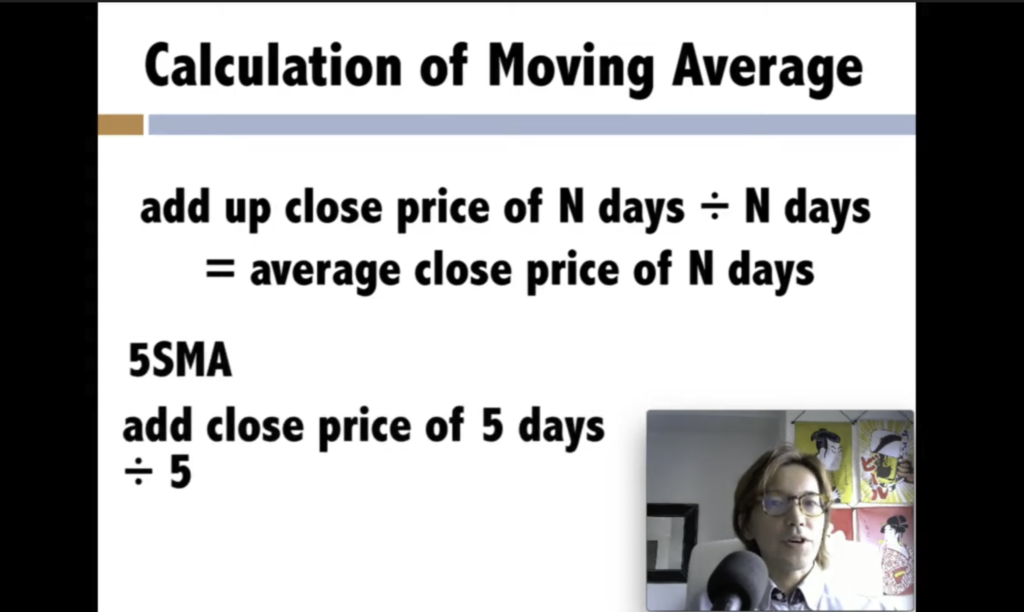
You know, in moving average, there are 5MA, 20MA, or like 100MA and on and on. Usually the capital letter N is used to symbolize how many days, but you take all the closing price of candle sticks for N days and divide them by N. It’s simple right? You take all the final closing price of each candle stick for certain days and divide them by the number of days. And it reveals the average ending price for the certain period. If it’s 5 days, then you take all the close prices for each 5 days, add them up, and divide them by 5, then you get the average closing price level for the past 5 days.
Ok, if you understand this, let’s move on to the next step, that is, what is the meaning of the calculation?
The meaning of the calculation
Let’s say you look at a daily chart and use Simple moving average with 10 time period. In that case, you take all the close price for the past 10 days, add them up, and divide them by 10, then you get the average closing price for the past 10 days. But what’s that for? Right? For what reason you get the average close price for the past 10 days? Just think about it for a minute…
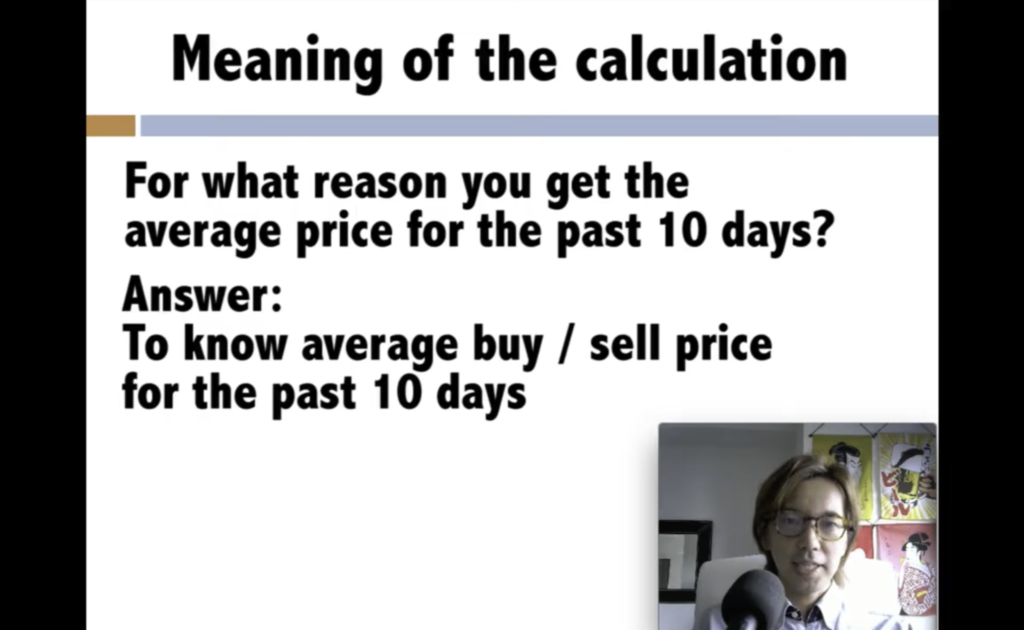
That’s because it tells you the average buying or selling price of all the traders in the market for the past 10 days. So if I may ask you “in USDJPY, what is average price level of all the traders in the market who buy or sell for the past 10 days? In average, what price do they buy or sell? Then you use this calculation and you can tell me the answer. So moving average indicator is to know what the average buying and selling prices are for all the traders in the market for the past certain time period.
Now, you may wonder “ok, I got why it’s for but why it says “moving average?” what’s the meaning of Moving? In other indicators, there’s no such a word “Moving” right? but why this one is named Moving average?
What is “moving” in moving average?
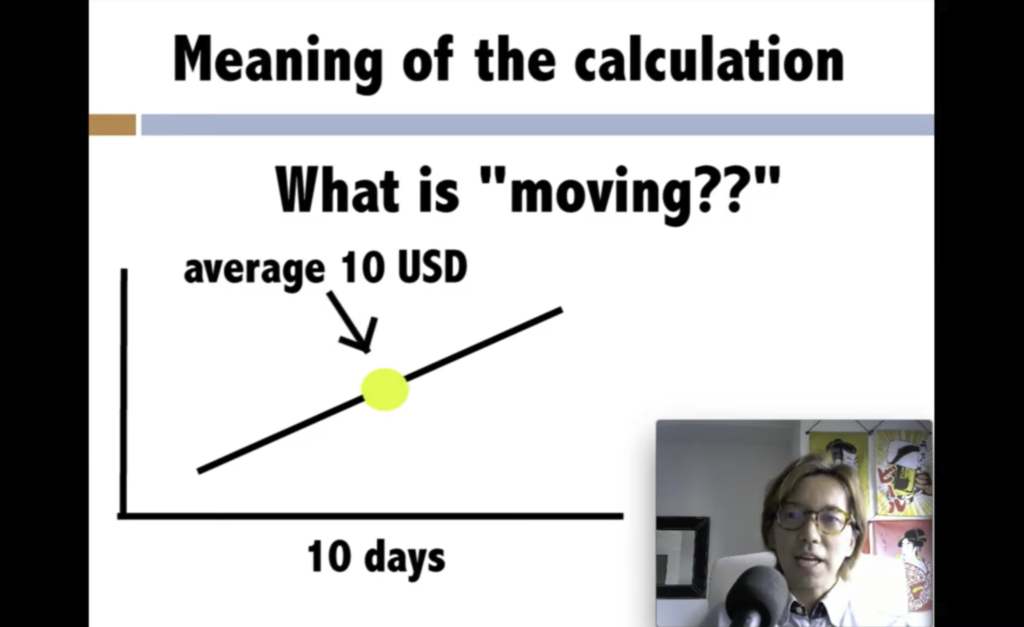
Let me tell you the answer. When it’s a moving average for the past 10 days, for example, and let’s say the average price for the past 10 days was $10. In that case, where do you usually put the answer in the graph? Usually it’s showed in the middle of this chart. For example, if the price keeps going up for the past 10 days and when the average is calculated to be $10, then usually it’s marked here in the middle. But in moving average, the answer is moved to the most recent candle stick. And that’s the reason why it’s called Moving average.
Why it’s moved to the most recent candle stick?
So the next question would be, why is it move to the most recent candle stick? Why do you think it’s moved? Well, if you know the answer, you will know what this moving average indicator truly wants to indicate with that calculation. So why do you think it’s moved to the most recent candle stick? Think about it for a moment…
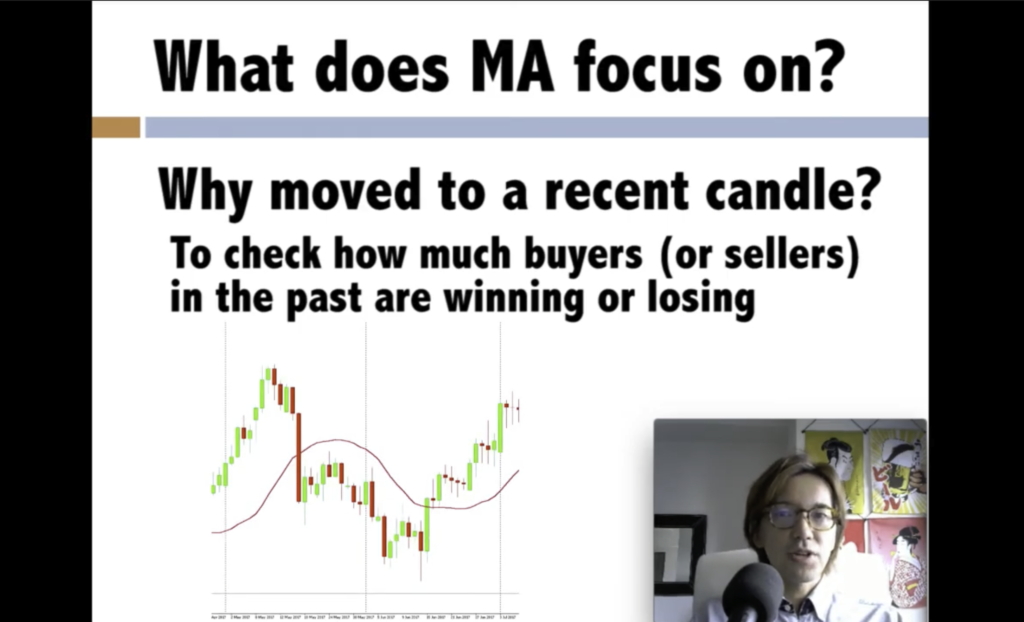
OK, time is up! The true meaning of the moving average is that this indicator is to check how much profit or loss the buyers or sellers have for the past certain time period and check if their profit or loss is extending or not. In other words, you can compare the profit or loss of buyers and sellers with today’s price. And to make it easier to compare them, it’s moved to the most recent candle stick.
So think about this, if you draw a 10 simple MA and if the current price is above the 10SMA, are the buyers for the past 10 days making profit or not in average? The answer is they are making profit in average. If the current price is below the 10 moving average, that means the buyers are getting loss in average. This is something I wanted you to understand clearly first.
And now, you are ready to know about the buy and sell signals with the moving average indicator, finally. You know, one thing I want to warn is that people just talk about gold cross for buy signal, dead cross for sell signal and on and on, and they only remember it without knowing why and eventually their focus becomes the signal’s reliability. So always try to see what the indicator is trying to tell you first of all, and see why it works, then you know why it doesn’t work in what case.
Trade Signals of Moving Average Indicator
So let’s talk about signals now. Look at this chart.
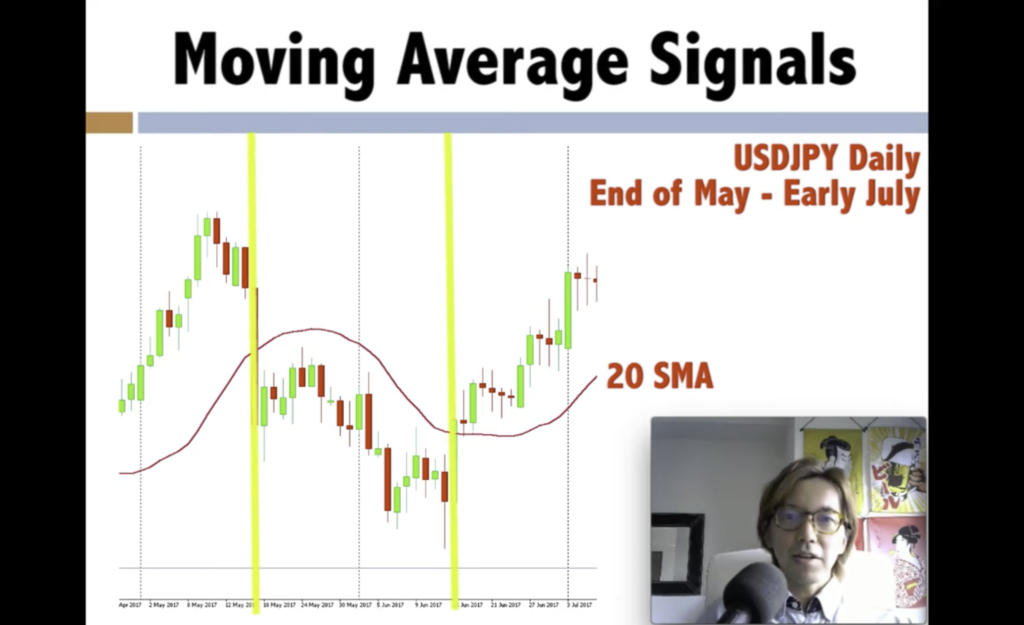
This is the actual Daily chart of USDJPY between the end of May and the early July, 2019. And this time, focus only on buyers. Here it shows 20 SMA, but if the price is above the 20 moving average, then the buyers for the past 20 days are making profit in average, right? Then look at the middle of the chart, the prices are below the moving average so you can immediately tell that the buyers for the past 20 days are getting loss in average. Then, on the right side, buyers started to make profits in average. So as you see, when it gold crosse or dead cross, that shift from winning to losing is happening. So the true meaning of dead cross is that all the buyers who were making profits for the past, they go into a world of getting loss.
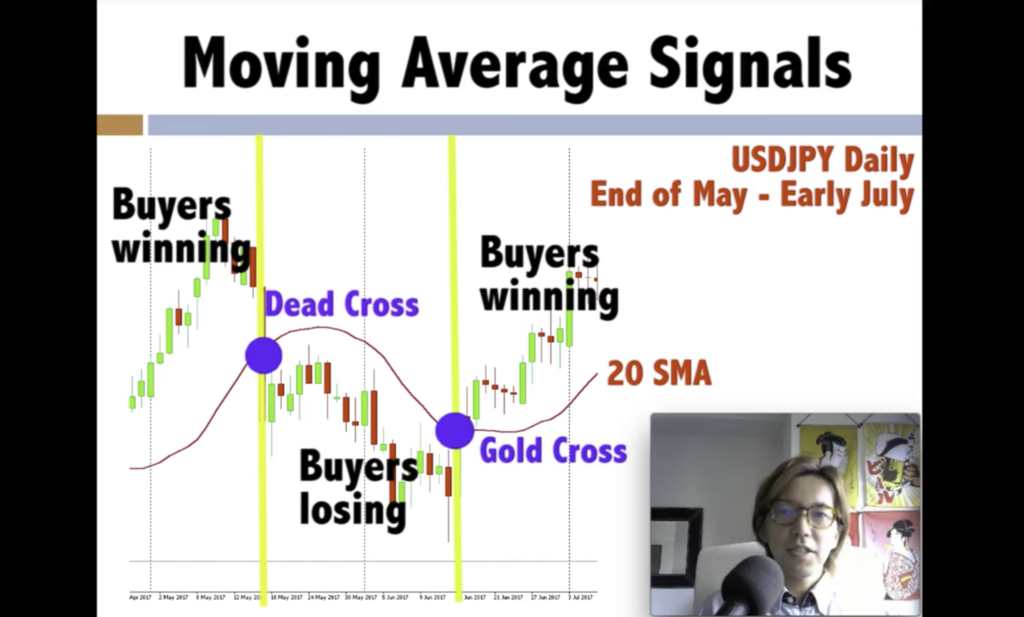
And what will the buyers do when they start to get loss in average? You know, after they start to get loss from this point, what do they think? If they are still on profit, they might think, oh look like the market is shrinking down so let’s just take some profit before I get loss, right? Or if he is already getting some loss, then he starts to think about cutting loss. And that’s why the dead cross called sell signal. So it actually shows the psychological shift of buyers and sellers and those signals reveal their emotional movement from profit and loss, and it actually reflects on the price action.
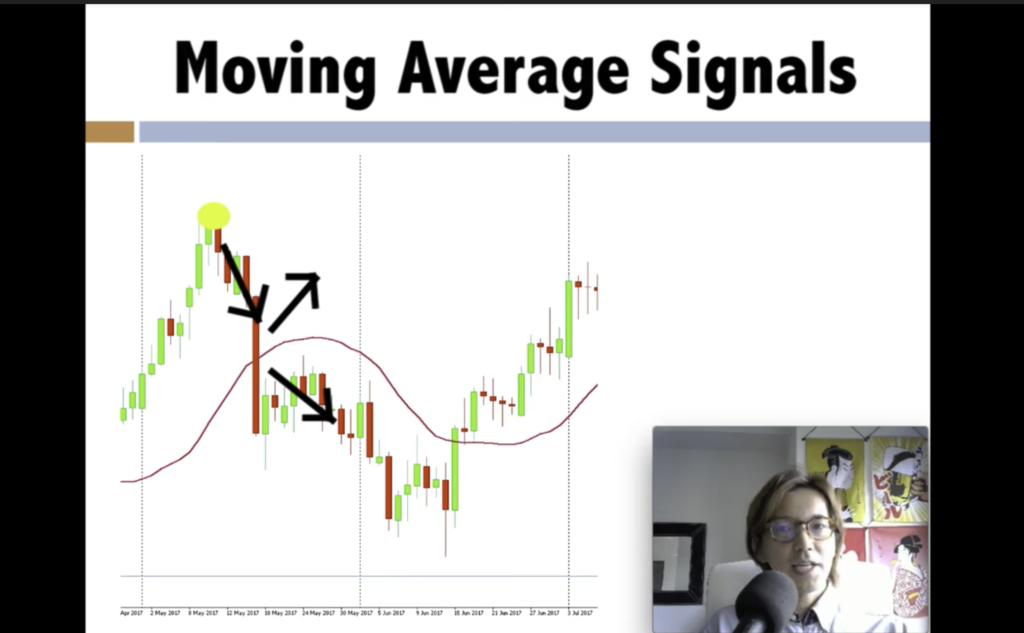
And another point is if the buyers make enough profit when the price is above moving average, what they will do is they take profit because they think they made enough profit. Then the price comes towards the moving average. And if the price touches the moving average, what the buyers think is that there are two kinds, they either take profit, or buy more. So when the price touches the moving average and if there are more buyers who think to buy than sell, then it works as a support and the price keeps going up. But if there are more buyers who take profit or cut loss, then the price will dead cross the moving average and then it becomes sellers world, you know, sellers start to make profit from that point.
So that’s basically what you can tell from the moving average and that’s why the past average close price is shown at the current candle stick. As you might know, there are ways to use two or three or like 16 moving averages to identify the market but basically it’s all the same because when you think about it, candle sticks are like 1 moving average, well I don’t know if we can call it average, but the mechanism of dead cross and gold cross is basically the same no matter how many moving averages you use.
You know, calculations are sometimes painful, I know, but if you look into it, you will exactly know what the indicator is trying to show you, so that you can identify the chart with multiple viewpoint.
Matane!