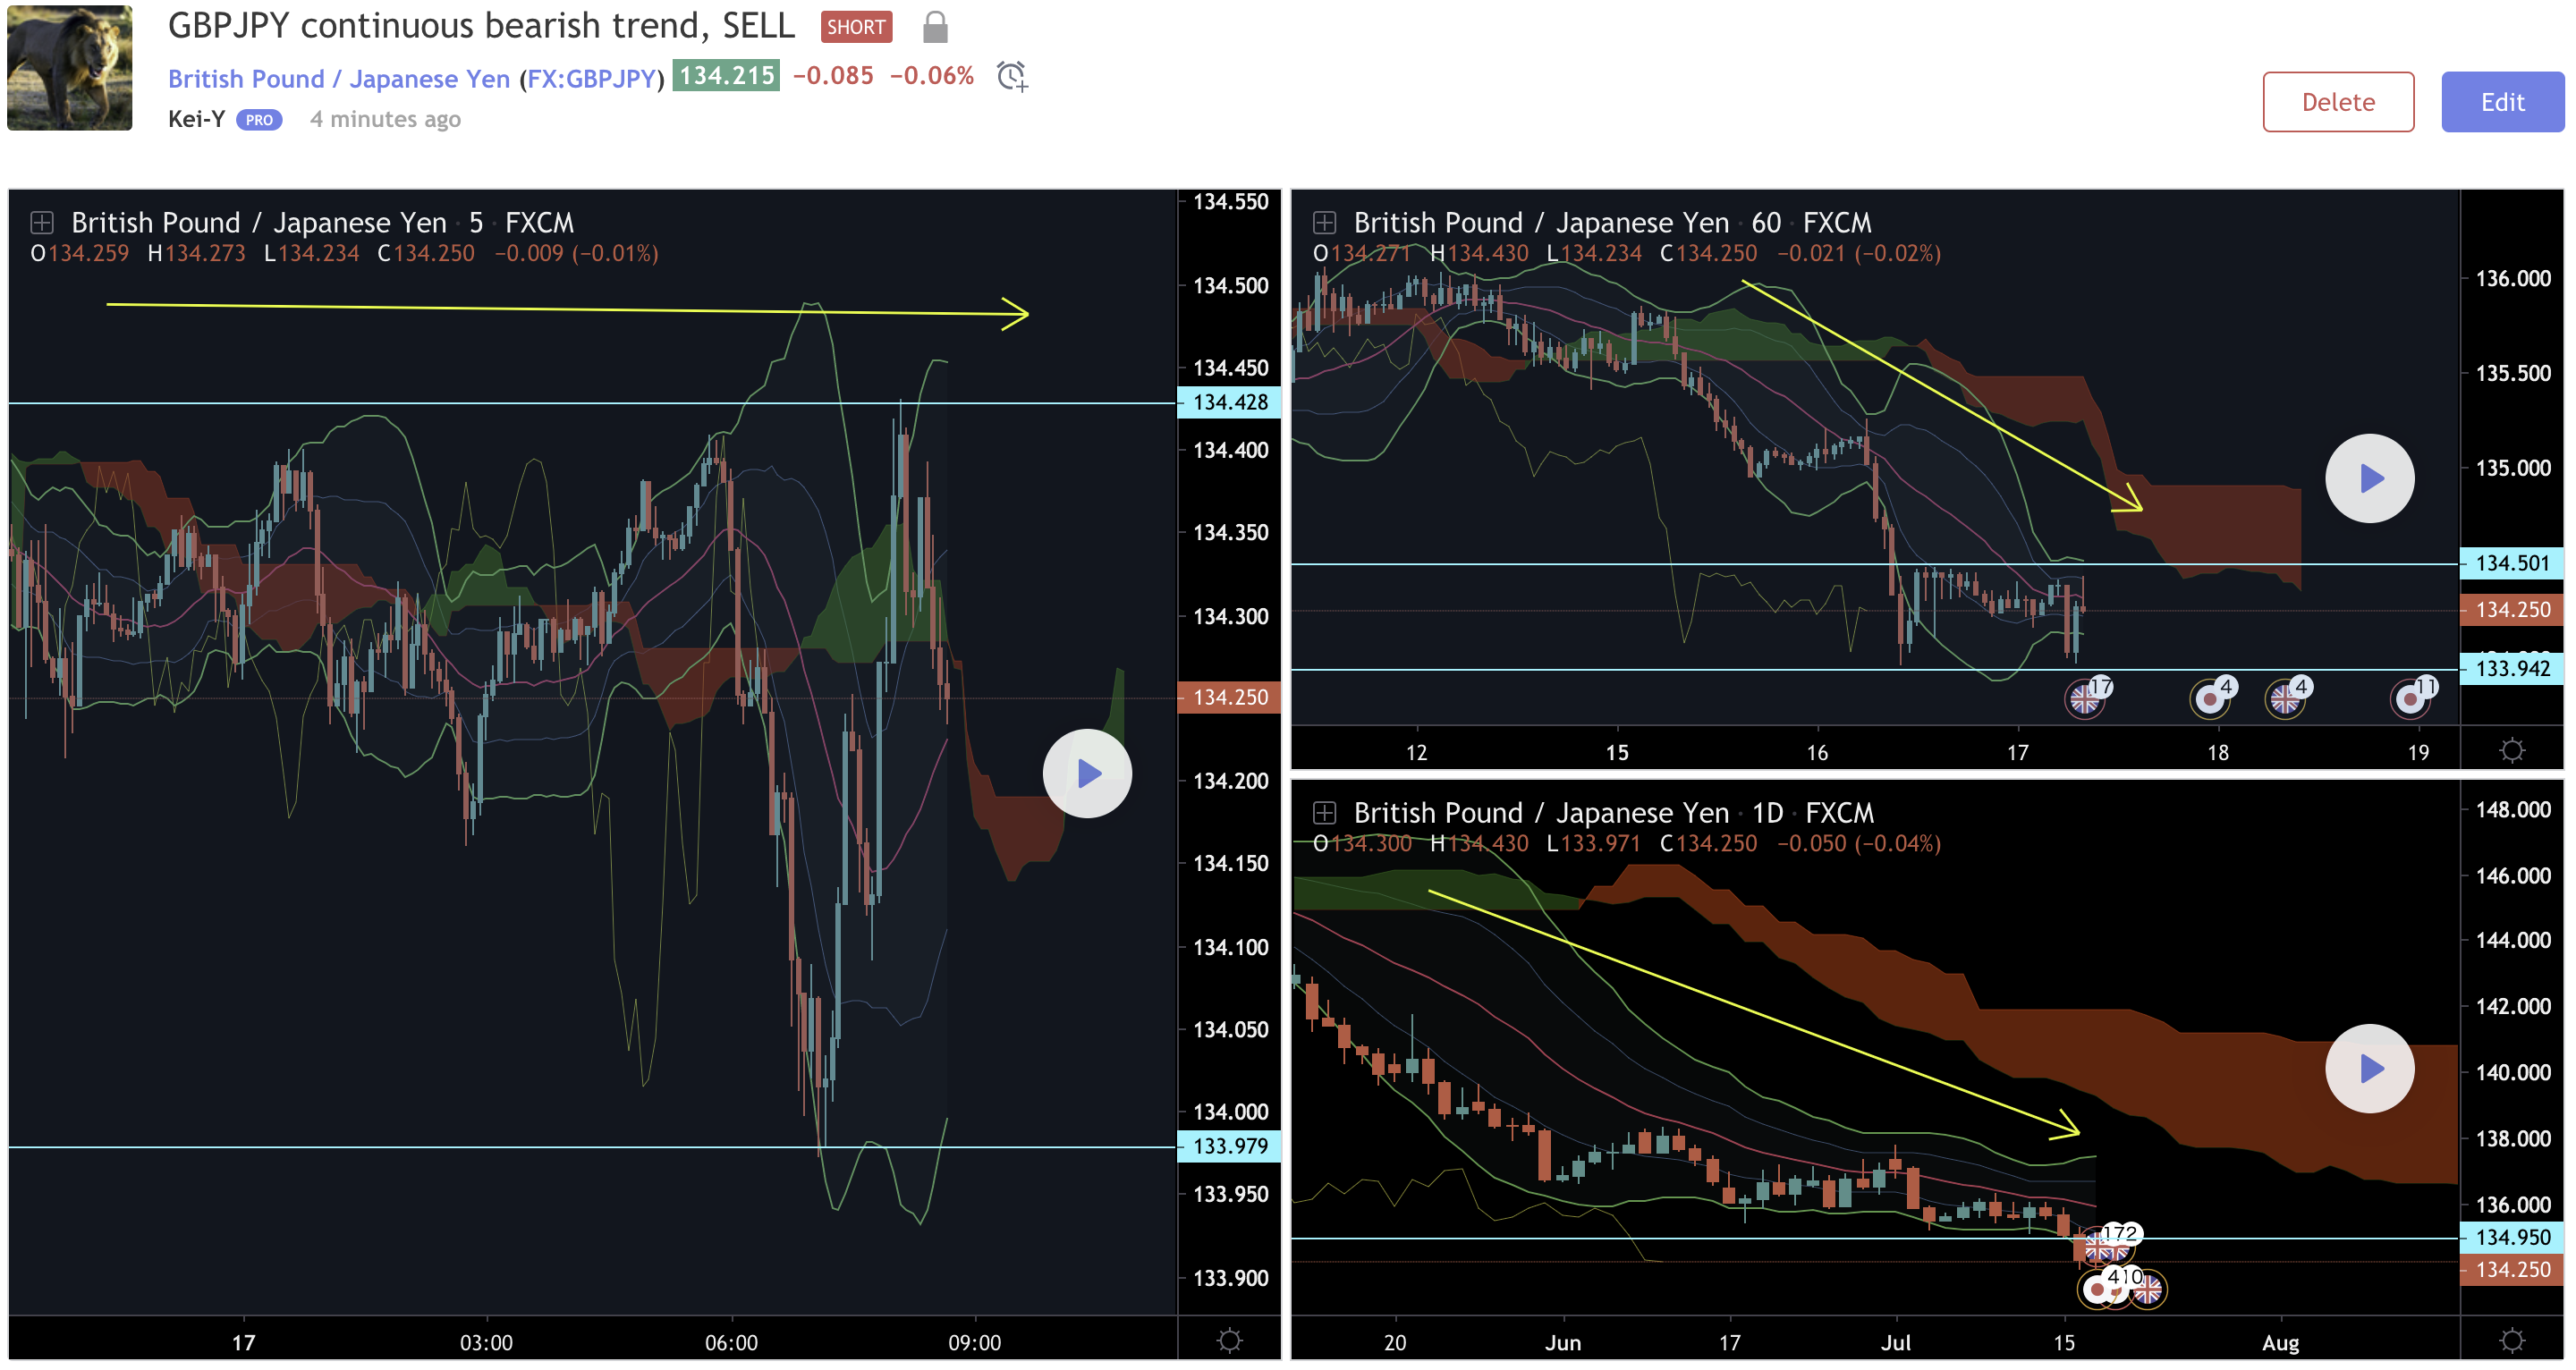
Daily Chart bearish
Daily chart shows continuous down trend as follows,
- Ichimoku Cloud
Price is below cloud. Chikou span is below candles.
- Bollinger bands
Price is walking along StdDiv -2 downwards
- MA20
MA is going downwards and price is below 20SMA.
H1 Chart range
- Ichimoku Cloud
Price is below cloud, however, Chikou span is about to interact with candles.
- Bollinger Bands
Current price is right in the middle of StdDivs, so it could go either direction. The bands are contracting, showing the price is charging energy for the next move.
- MA20
The price could be resisted by the SMA20 and go down.
Also, I can see that there’s a resistance line at 134.501 and support line at 133.942 and the current price level is right in the middle.
M5 Chart range
- Ichimoku Cloud
The cloud is horizontal and Chikou span is interacting with the candles.
- Bollinger Bands
The price was resisted at BB’s StdDIv +2 at 134.428 and coming back down now. The bands are expanding and getting ready for the next contraction.
- MA20
SMA20 is moving up and down. Not reliable indicator for M5 timeframe.
Trade Strategy
Sell in a long term.
As the price gets close to a resistance line in H1 at 134.501 and touches BB StdDiv +2, then sell as Daily chart shows it’s a down trend.