This is my analysis on EURGBP because first of all, I see it’s a good chance to buy and I will tell you the reason from my own analysis, but today, I wanted to talk about how to see a chart without any bias so that you can always be flexible whether the price goes up or down, because no one can predict the movement in the future.
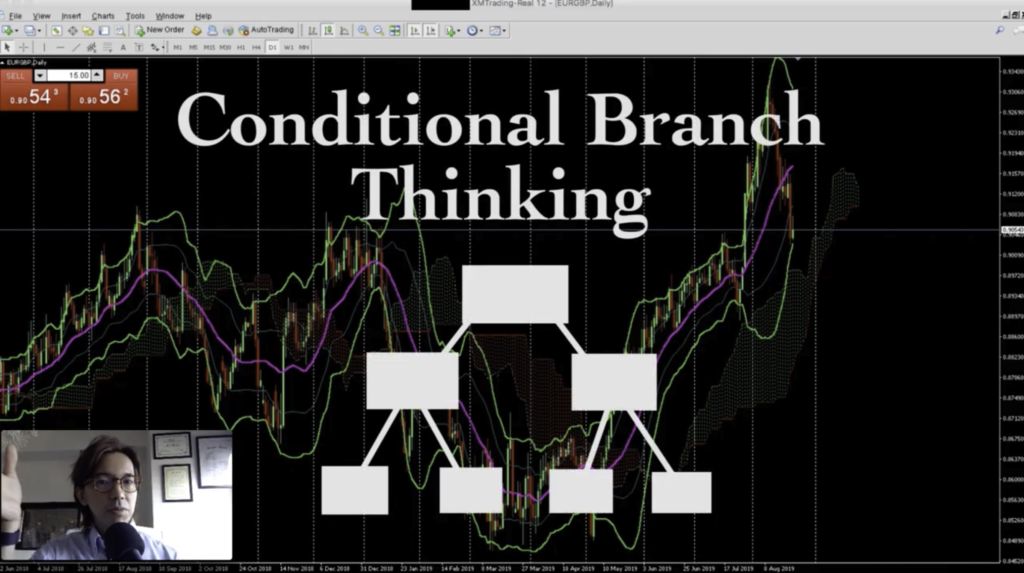
But good traders always make profit over time because they have plans, and those plans are based on “if” questions, like “if the price goes up, then I will do this” or “If the price goes down, I will do that.” things like that. It’s called “conditional branch thinking” like you create few scenario depending on the possible conditions of the chart, so it’s kind of close to the algorithm in programming. And this is the thinking pattern I always have every time I trade, and I will show you how I do this.
Watch the video
EURGBP Daily Analysis
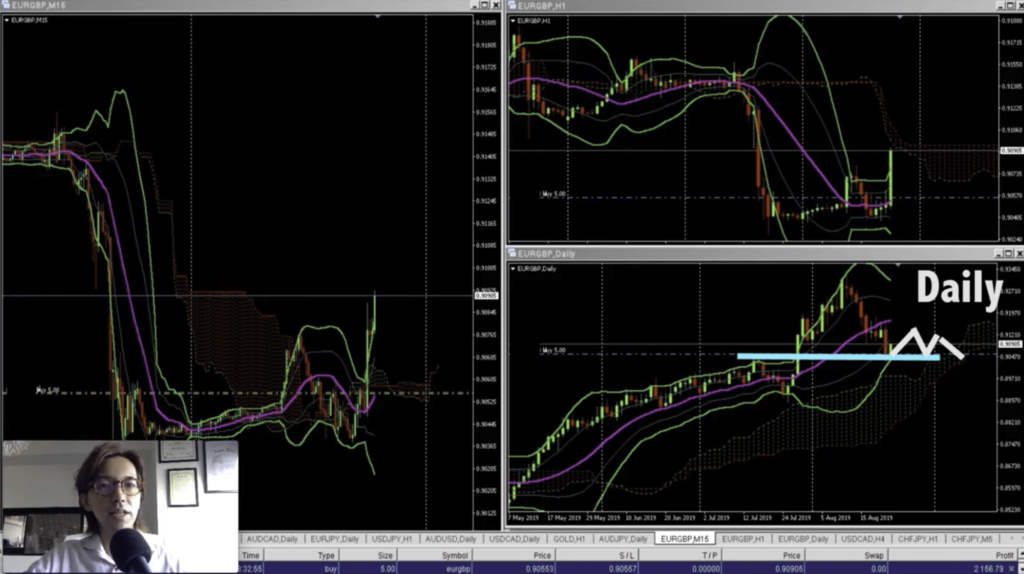
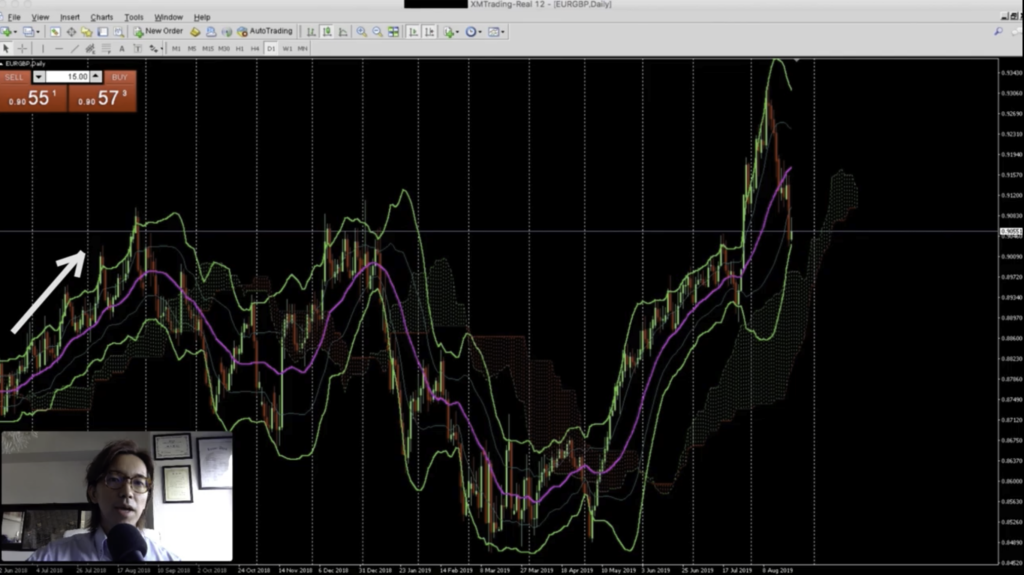 Ok, this is the Daily chart of EURGBP since the last year of June but let’s just overview the movement first.
Since last June, the price went up, supported by this 20MA, the pink line. Then, it broke the 20MA downwards, and also Ichimoku cloud, so it suggested it’s the end of the bull trend on this Daily time frame. Then, it went up and down a couple of times, creating like W bottom, then the price went up, but it couldn’t go over the recent highest, so eventually the price was resisted and went straight down, breaking 20MA and Ichimoku cloud downwards, then it went up once, or twice, then it went down further.
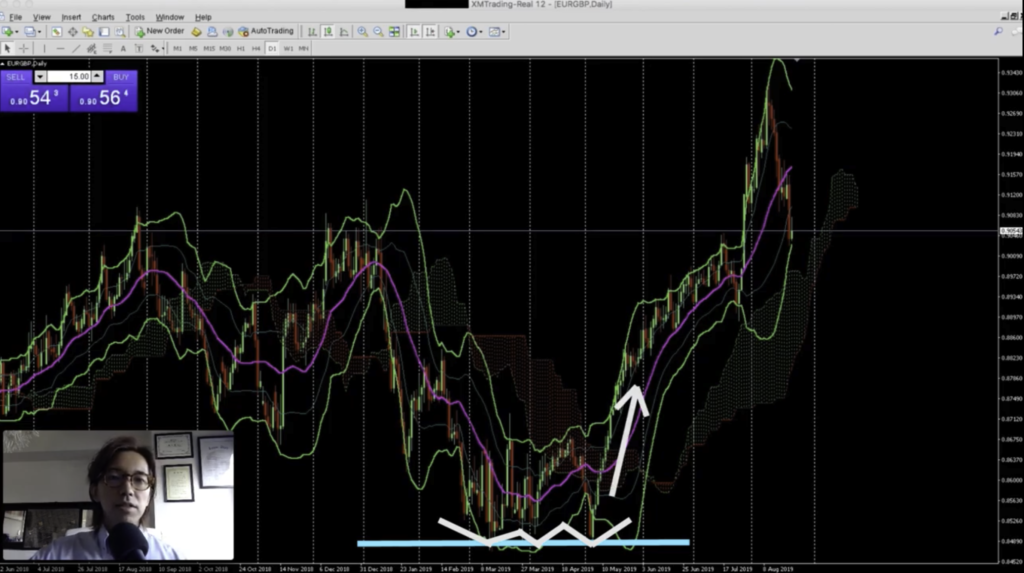
Then the price has been supported at this 0.8489 level couple of times, and created like triple bottom, and after that, the price broke 20MA and also Ichimoku Cloud upwards, and started bull trend. Later the price has been supported by this 20MA couple of times, but in the end of July, as you can see, it went down to this level, where you can draw a line like this on these points, then it went straight upwards, breaking the recent highest and renewed the highest price level, then now, it’s coming back down to the previous highest price level.
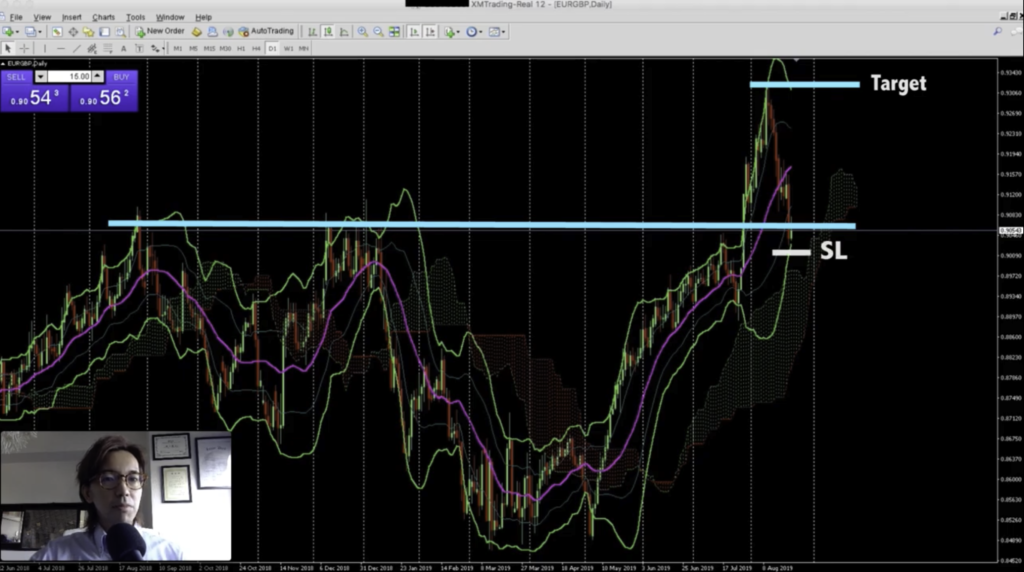
So as far as I see this chart, it’s a great place to buy because if the price is supported on this level, the initial target could be the recent highest up to the highest level which is about 250 pips, and in that case, and the stop loss would be right below the most recent lowest, so the risk to reward ratio will be very good.
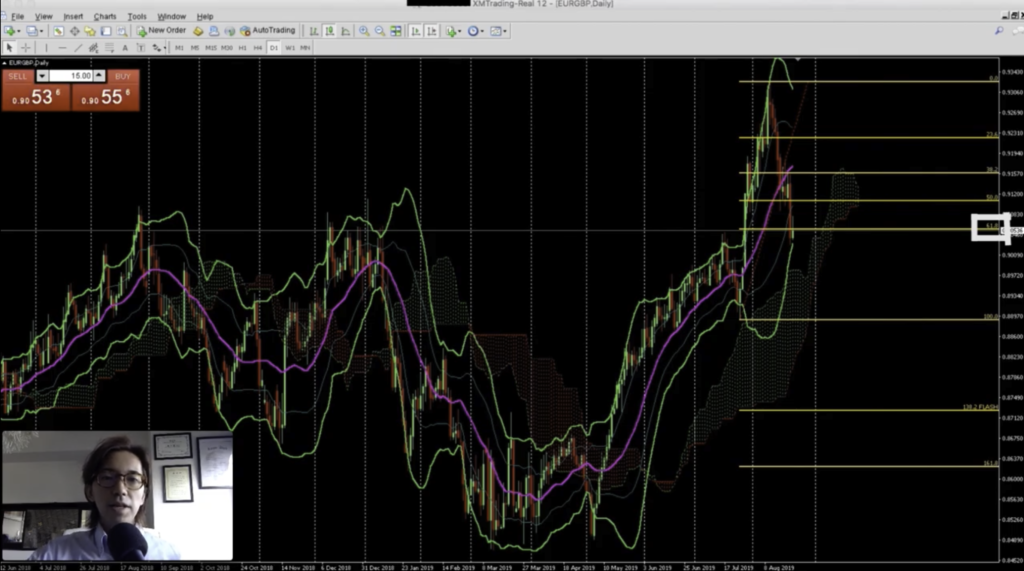
Also, when I place the fibonacci retracement between the recent lowest and highest, , the current price is near 61.8%, so if the price is supported by this level and go up, then I can expect a big profit, and it would be a great entry timing. Alright, that was the scenario when I buy in this condition.
But think differently. Imagine when the price breaks downwards here.
If the price breaks this level downwards, initially the price might extend because there might be stop loss orders of those who have buy positions below this line, so if the price breaks here downwards, it could go down to this level.
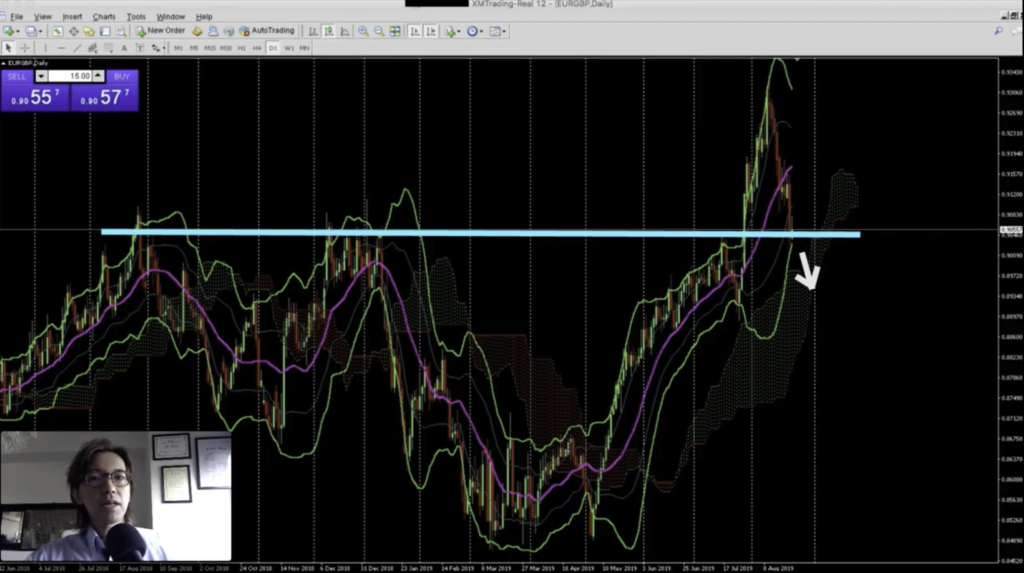
Another case might be it will be a range for a while at this level, you know, consolidate and hovering around, and eventually goes up or down. That’s something we never know. However, I am thinking to place buy for now, and I will tell you the reason why later.
Alright, let’s look at H1 chart and see the current price action closer.
EURGBP H1 Analysis
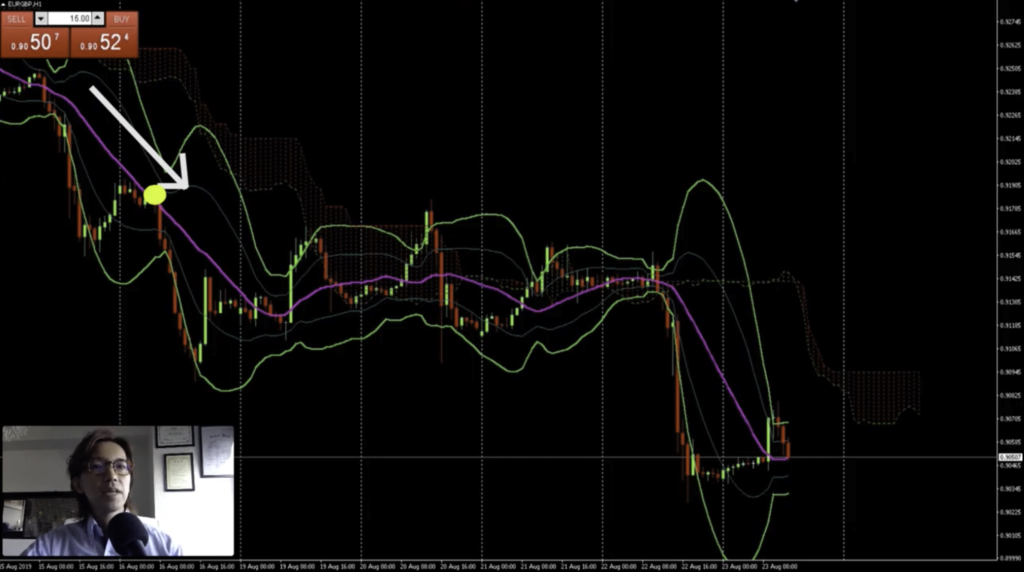
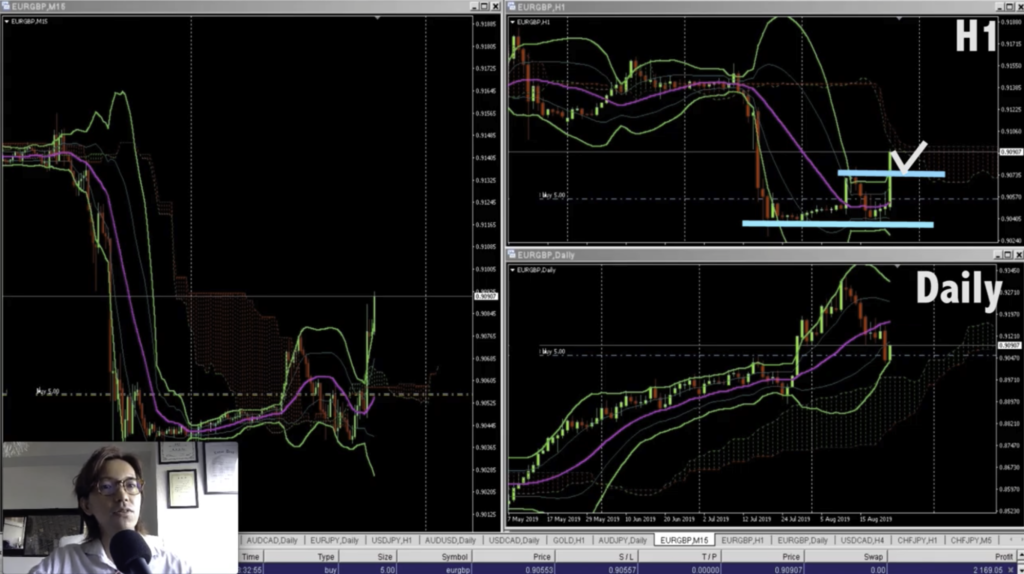
This is the H1 chart of EURGBP as of 23rd of August, 2019.
And if you look at it, few days ago, the price was coming down, resisted by 20MA.
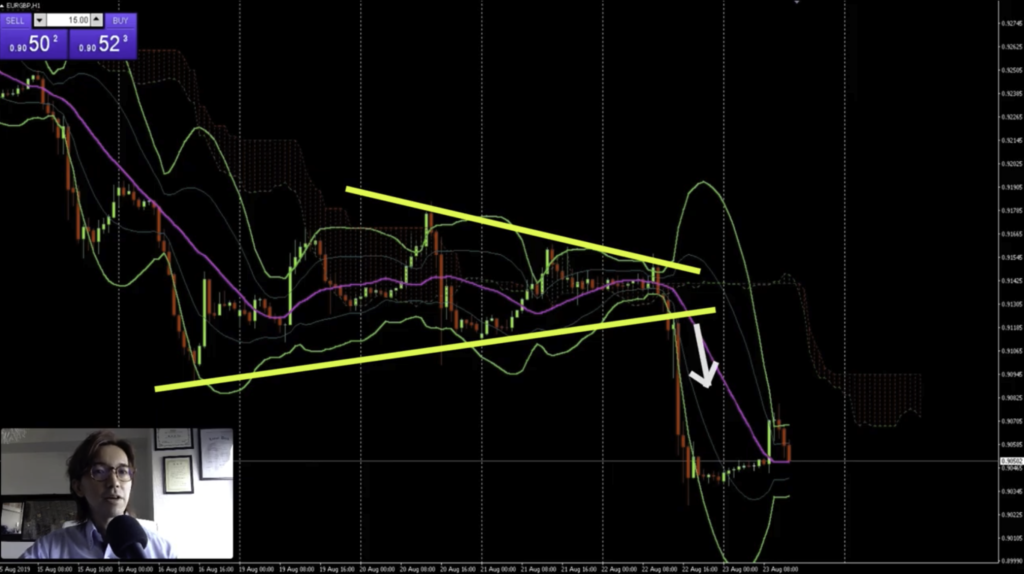
Then, it became a range consolidation, kind of looking like a flag pattern here, and the price broke downwards by following the bearish trend direction of this H1 timeframe.
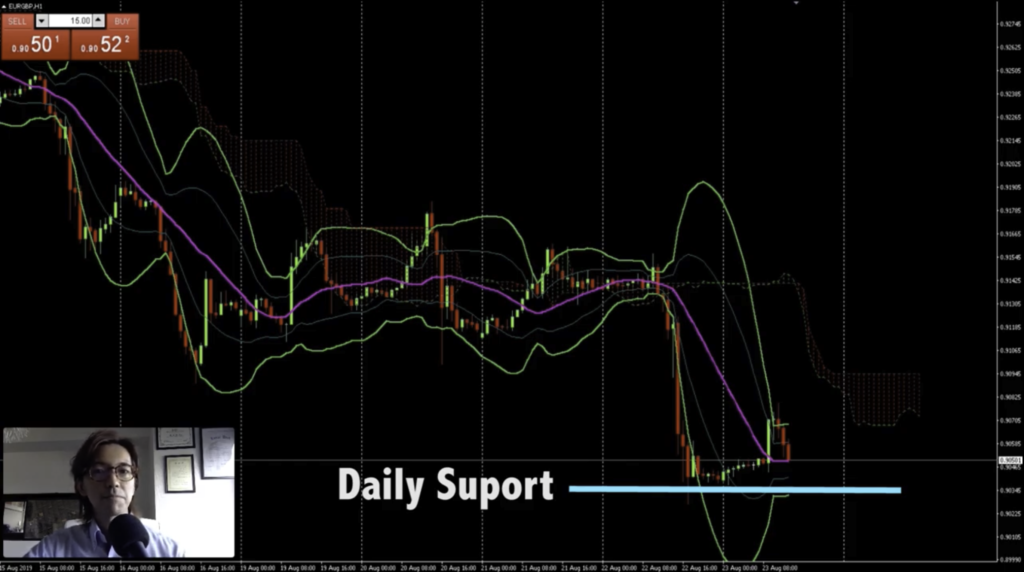
And this is where the support line is in the Daily chart as you saw earlier, so that’s why the price stopped here.
And this is why I see multiple time frame because if you don’t look at Daily chart and only looking at this H1 chart, you never expect the price will stop here, right? And you might be jumping in to the market and sell here, after you saw this huge drop, and you will be getting loss by now. You know, because of the bearish trend on this H1 time frame, there was a chance that it might not be supported here and went straight down, and it still may be the case, but that’s something that no one knows. But if you are able to see a line here on Daily time frame, at least, you have an expectation that the price might be supported here, and it could bring you an additional option to create your own scenario.
And that’s why it’s important to see a chart in multiple viewpoint, so that you won’t be biased toward just 1 direction. So whenever you place any orders, always think from buy side and sell side, then you make your own call. That way, you won’t be fooled by the price actions that you didn’t expect.
So anyways, as far as I see the chart, the price looks to be supported on the Daily support line, and I see the long wick pointing downwards, so that’s why I think this is a great chance to buy here. Plus, if I place long here, the risk, right? the stop loss will be placed here and it can be just like 20 pips, which is a good deal to expect a big amount of reward towards the previous highest of Daily time frame which is like 250 pips, which means the risk to reward ratio is like 1 to 12 on this trade. And also, even if the price goes backwards and get loss cut, I just get 20 pips, and it makes me easier to control lot sizing too.
So I could place long on this H1 time frame, but let’s just see M15 chart to see what we can analyze further.
EURGBP M15 Analysis
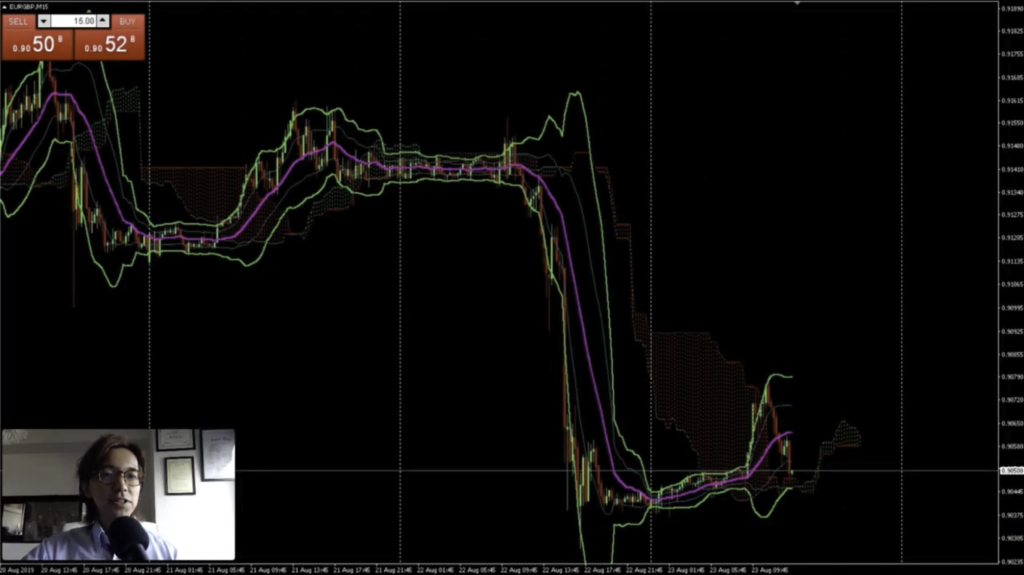
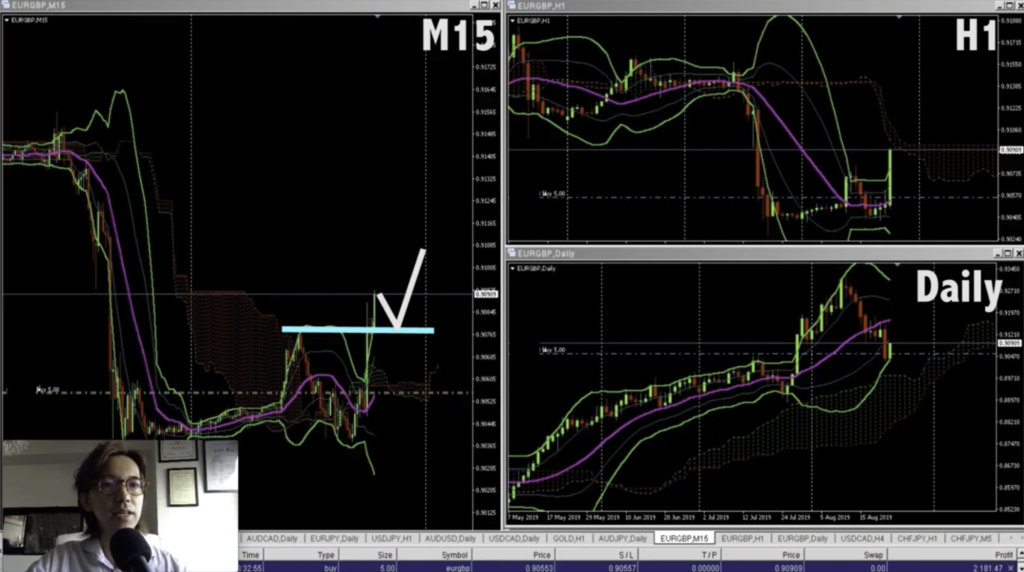
Ok, here is the M15 chart. Look how fast the price dropped yesterday, then supported on this level as we saw in Daily time frame.
And after the drop, you can see the price has been lower high, higher high, and it’s moving up gradually. So you can see the current sentiment of the market is bullish within this smaller time frame.
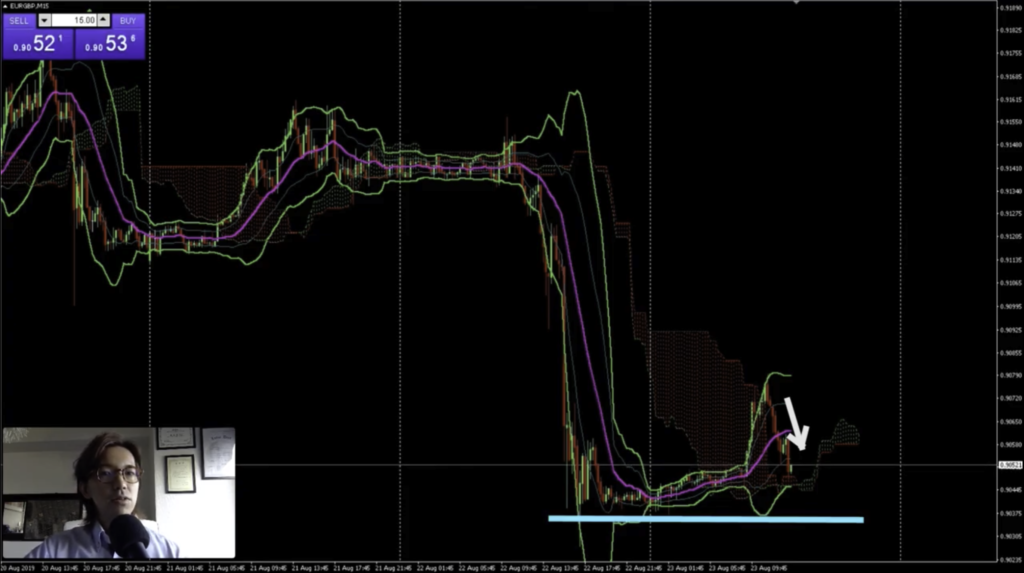
However, the recent pull back is strong here, but as long as the price won’t break this lowest level downwards, we can say it’s still bullish.
So let me place buy here,,, and place stop loss right below the recent lowest price level. I just go for 5 lots this time because of 2 reasons.
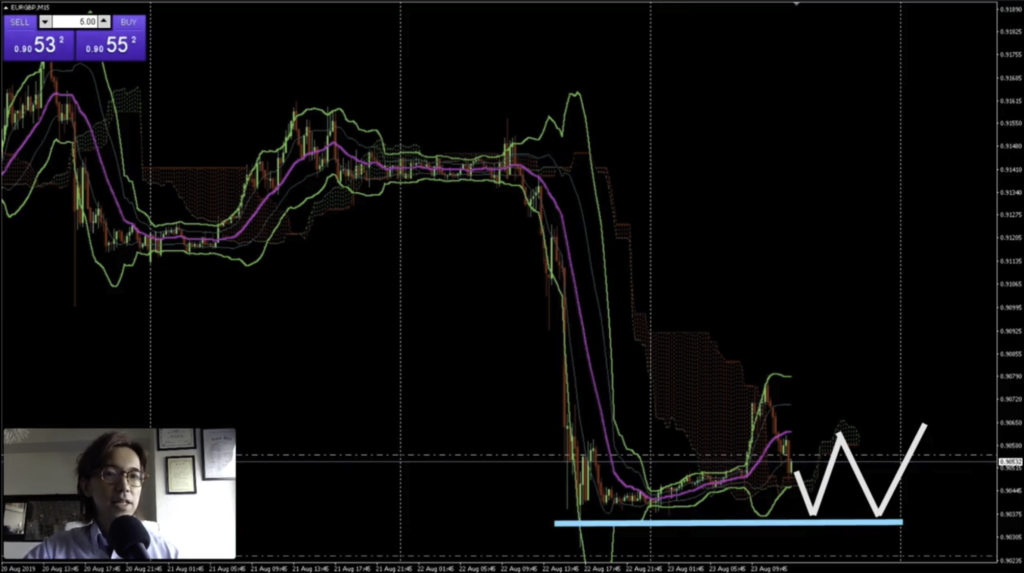
1 is I am still doubtful that the price might be break downwards, because I still don’t confirm the push backs after the spike down. Like if the price is pushed back twice or couple of times here, then the support here will become more reliable, but I don’t see that evidence yet. that’s why I am still doubtful.
But the reason why I placed long here is, and this is why I placed just 5 lots, but that’s because like I said earlier, I expect high reward on this trade, you know, the target is the recent highest on Daily timeframe, which is like 250 pips. So on this trade, it will be like a swing trade, you know, like I will let the time earn money, not by the lot sizing and leverage. I don’t know how many days I will hold the position until it hits the target, but as long as it remains on bullish, I will keep holding the position.
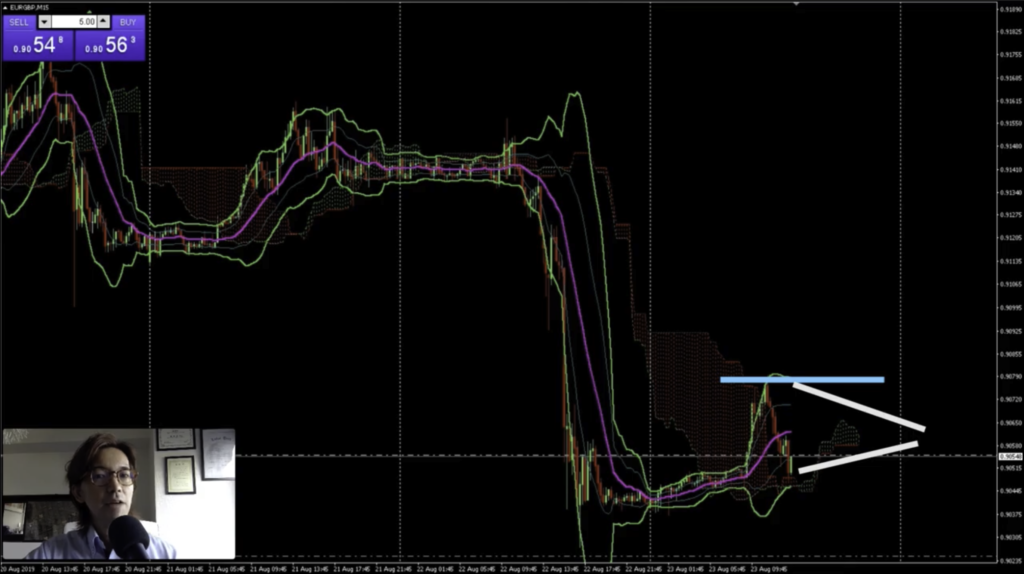
But for example, if the price is resisted here a couple of times, or if there will be a triangle of flag chart patterns here, then there will be a great chance that the price will drop down further, so in that case, I will close the position before it hits loss cut.
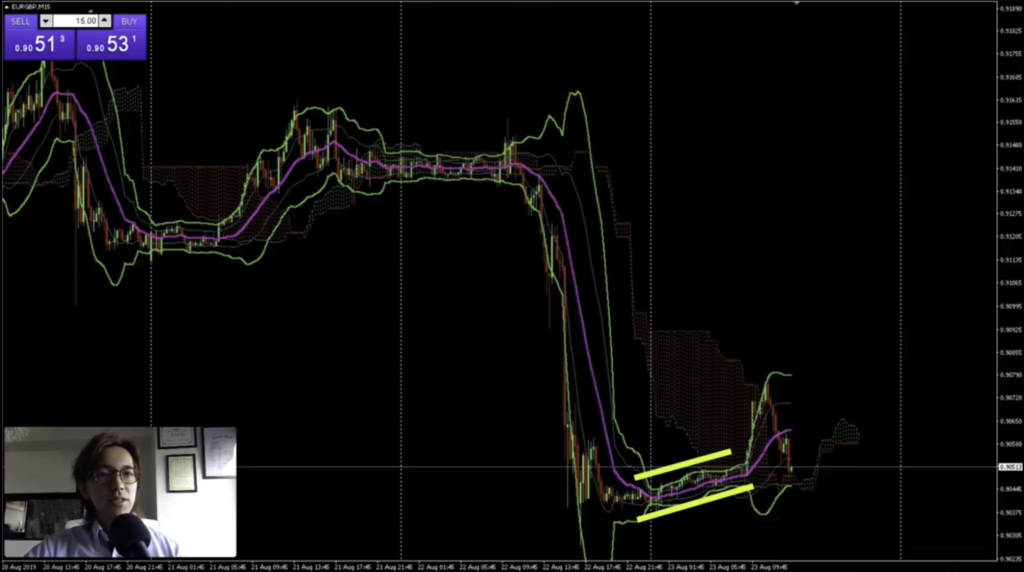
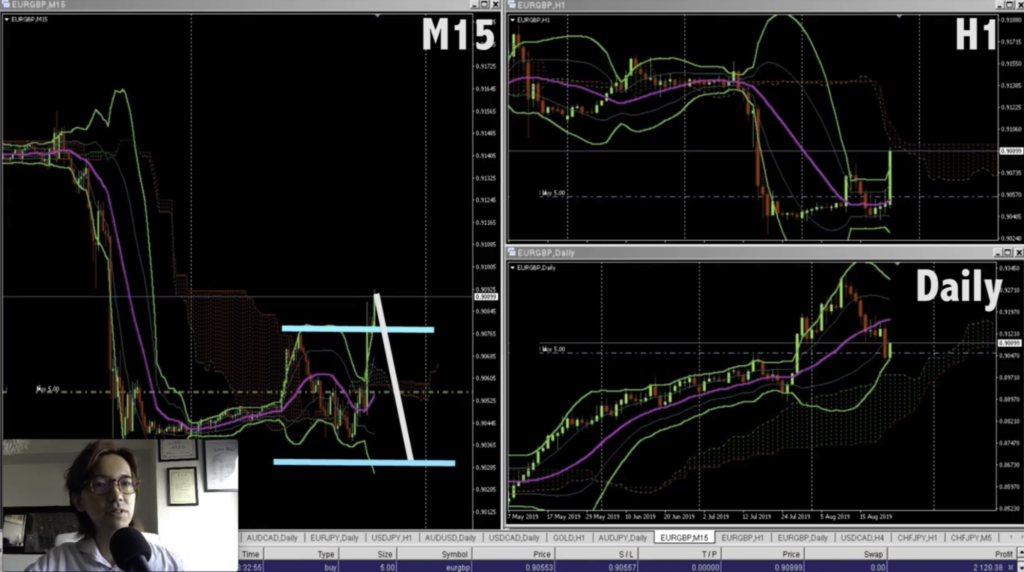
After Few Hours…
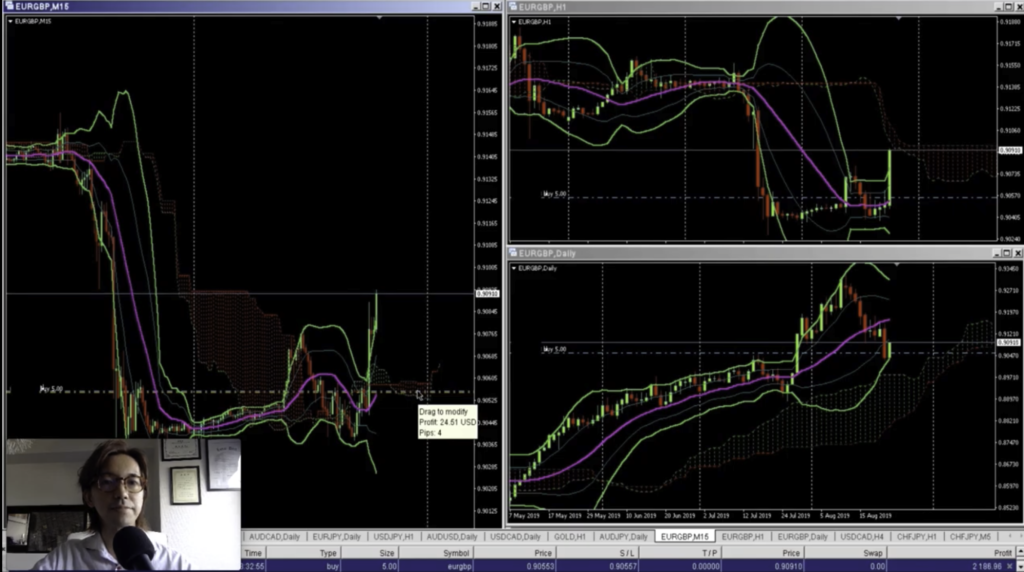
Here is the chart after few hours later. I was actually watching the chart whole time but when I was looking at the price action earlier, I was about to cut loss if the price breaks this support line downwards. But eventually it was supported second time, slightly like lower high here, and the price keeps going up and I have like 30 pips of profit now, so let me move the stop loss to slightly above my position so that it will be either win or break even game, because I will be going to bed anytime soon, so this way I will avoid the loss.
Alright, so, what I see is that first of all, if you look at a Daily chart, the price still looks to be supported on this line for now, but it might be tested couple of times in the future like this, and eventually goes up or breaks downwards. And if it goes down, then I will see if the price will be supported by the Ichimoku cloud and goes up or not. Or the price might break it downwards, you know, where the cloud gets thinner here. But as long as the the bullish momentum extends, I will just keep chasing with profit.
Then, what can you read from H1 chat? It shows the price has been supported twice on the Daily support and it went beyond the recent highest. So like I said, the price might be coming back down and test the second support line couple of more times and eventually go up, or breaking it downwards. However, if the price breaks the cloud upwards, then there might be a chance that the price keeps going up, you know, supported by 20MA.
Alright, and what do yo see in M15 chart? It looks that the price already broke Ichimoku cloud upwards and if the price is supported on this level of the recent highest, you know, if the resistance line turns into support line, there will be more chance that the price will keep going up.
But at time same time, the price might break this line downwards and it keeps going down to test this lowest support line again. In that case, I will just lose the position with break even, then I will just look for another chance to buy again with high winning probability.
Have “Conditional Branch Thinking” to create a trade scenario
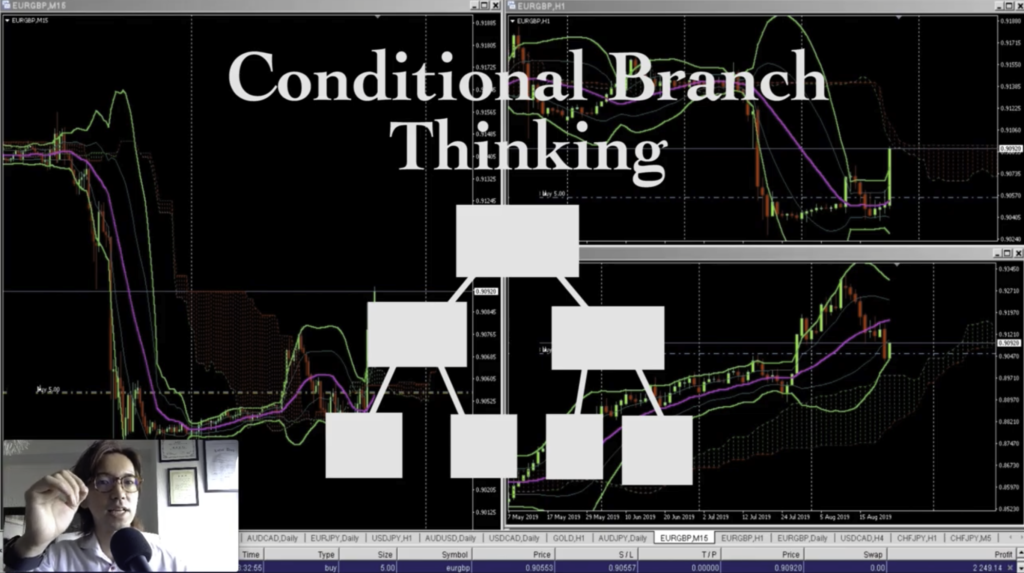
So today I tried to explain the chart with both up and down scenario. And this thinking pattern is very important in trading because if you are biased just in 1 direction, or only in the direction of your holding position, then you cannot see the other side of the coin, and when the other side actually turned out, you might get panicked or regret, or blame yourself or others whoever gave you that signal.
So no matter what indicators you use, always make sure to see the other side of the coin, and get ready for it. Like I said in the beginning, conditional branch thinking is the key to success in trading like myself in a long run.