This was recorded live on 29th of May on last Wednesday, 2019. I am about to trade this USD/JPY and just looking at the chart and start analyzing the current market situation. Alright, let’s get started.
Watch Video
Script
May 29 Daily Chart
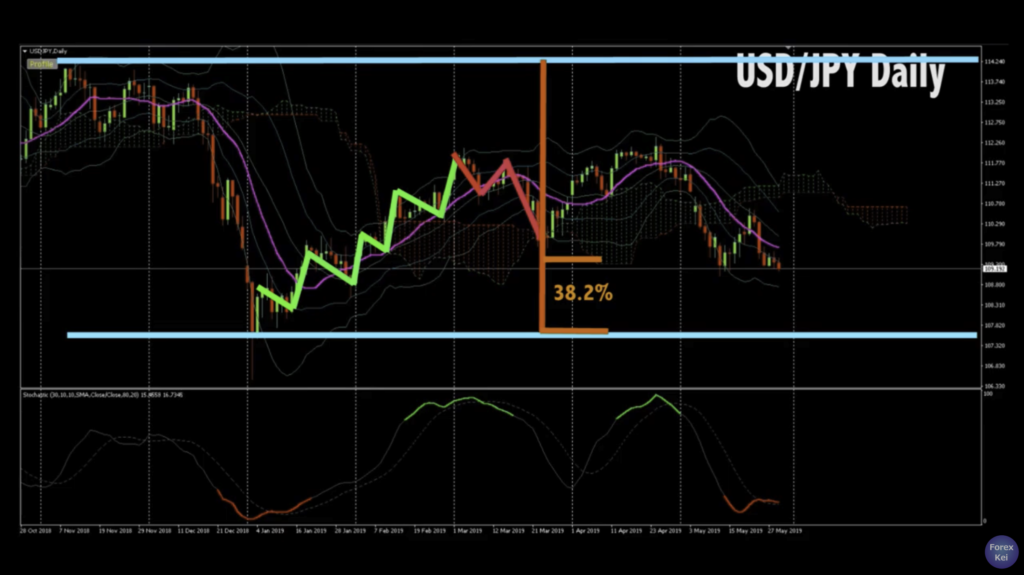
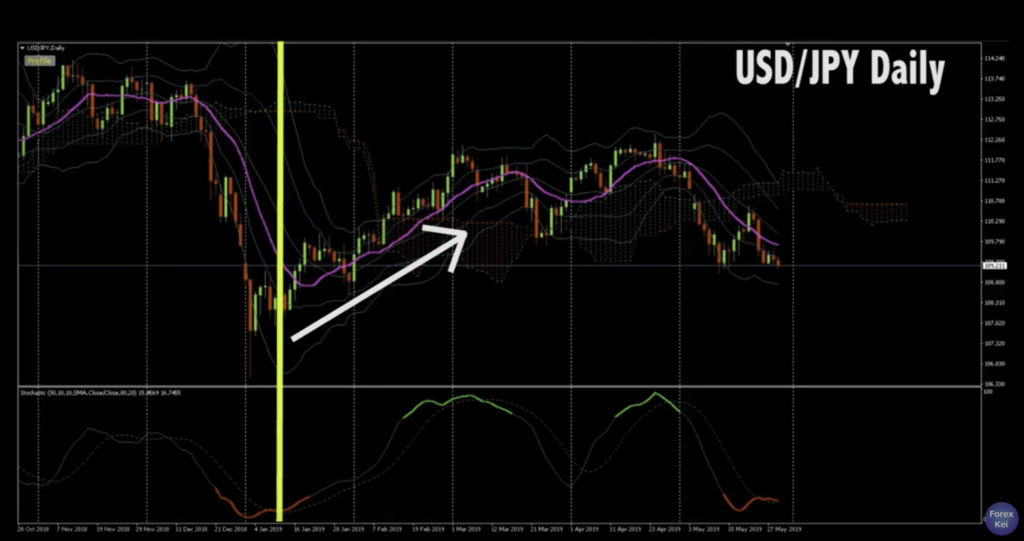
This is a Daily chart of USD/JPY. Now, if you draw lines like this, you can see that it’s a wide range and the current price is somewhere lower part of that range. And if you focus on the range, the price went up with 8 positive bullish waves, then the price could not go above the previous highest, then it went down with just 1 negative bearish reverse N wave and the price stopped at around 38.2% fibonacci rate within the whole range. Then, the price went up, down once, then went up again, creating 1 positive bullish N wave. After that, the price kept going down every day with single bearish I wave, pretty strong down trend, then the price pushed back up at like 38.2% of fibonacci level between the recent highest and lowest. Then it went down to the current price.
Now, when you look at the current price, it right at the recent lowest and might create W bottom and the price might keep going up. Or, after the price has been resisted by the descending trend line or this red moving average, it might be pushed back down and might keep going down afterwards to the bottom of the recent lowest of the whole range.
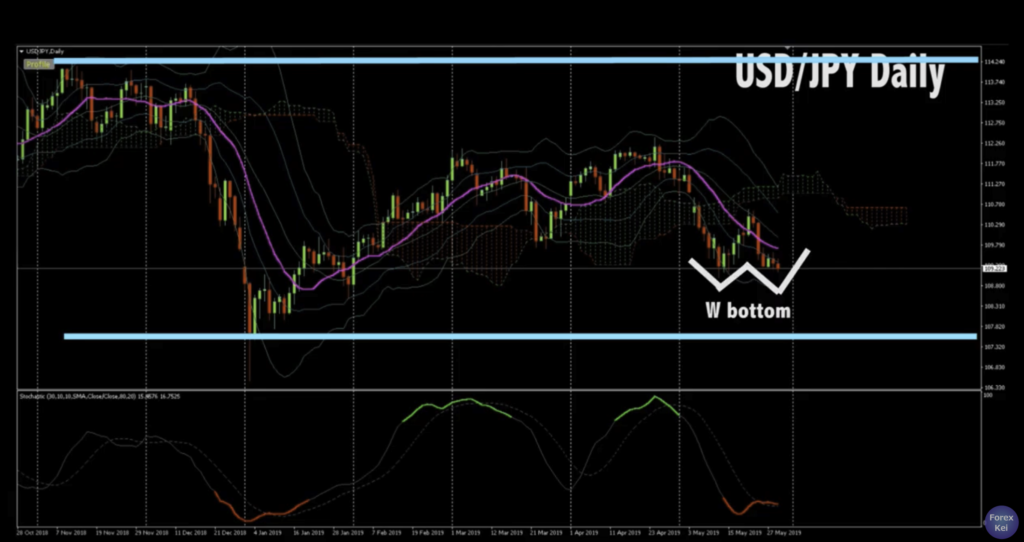
When you look at Ichimoku Cloud, it’s showing green, showing bull trend but because it’s thin and the price is below the cloud now, and because the cloud is moving horizontally, I would say the indicator is not reliable in this environment.
Also when you look at the stochastics, looks that it’s functioning right, like from this bottom, after the gold cross, the price went up, then after dead cross here, the price went down, and here, too, the price went up with gold cross, then the price went down with the dead cross. Now the current stochastics shows from the lower level below 30% as it shows in red color, therefore, from the patterns so far, there’s a chance that the price could go up after it’s gold crossed.
Now, let’s look into 1 hour chart next and see what we can find.
May 29 1H Chart
Here is a 1H chart.
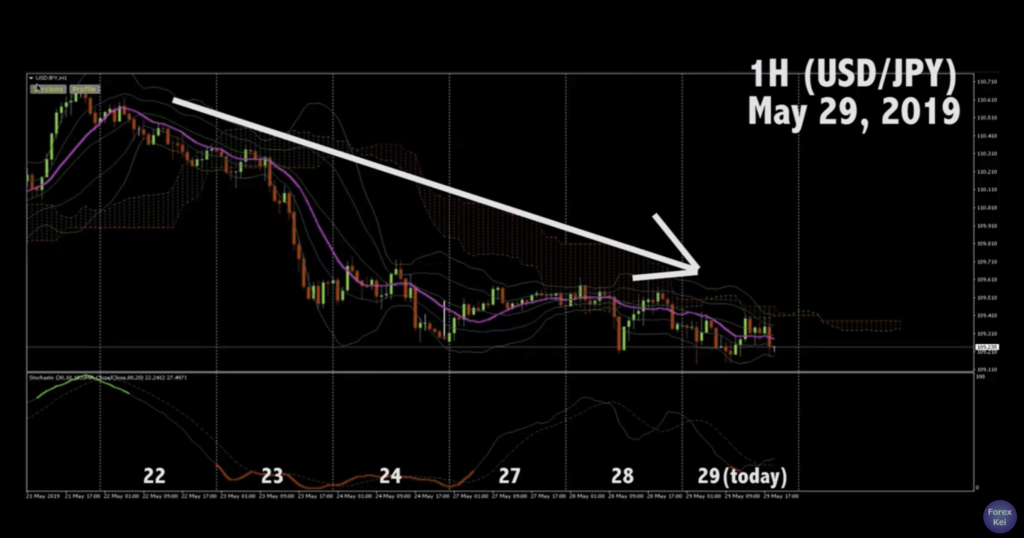
And as you can see, it’s showing continuous down trend for 6 working days. Since May 22nd on Wednesday, the price gradually went down and on 23rd, the price went straight down about 80 pips and because of the spike down, on the next day, the market became range, then went down a little more, about 20 some pips. Then on 27th last Monday, the price went up a little bit and on the 28th Tuesday, when the market opened up, the BB becoming narrow, charging its energy for the next move, and because on this day, the price looks it’s been resisted by the Ichimoku cloud, the price went down to the recent lowest, then it went straight back.
Actually I placed an order right before it spikes down, and moved the stop loss to the entry point. but unfortunately it did not break downwards so it ended up with break even.
Anyways, the price went up after it marked the recent lowest, like alphabet V as Victor, then the price again looks to be resisted by the Ichinoku cloud and dropped to the recent lowest again.
The width of BB is becoming narrow, meaning the volatility is getting smaller now and the market is charging its energy for the next move.
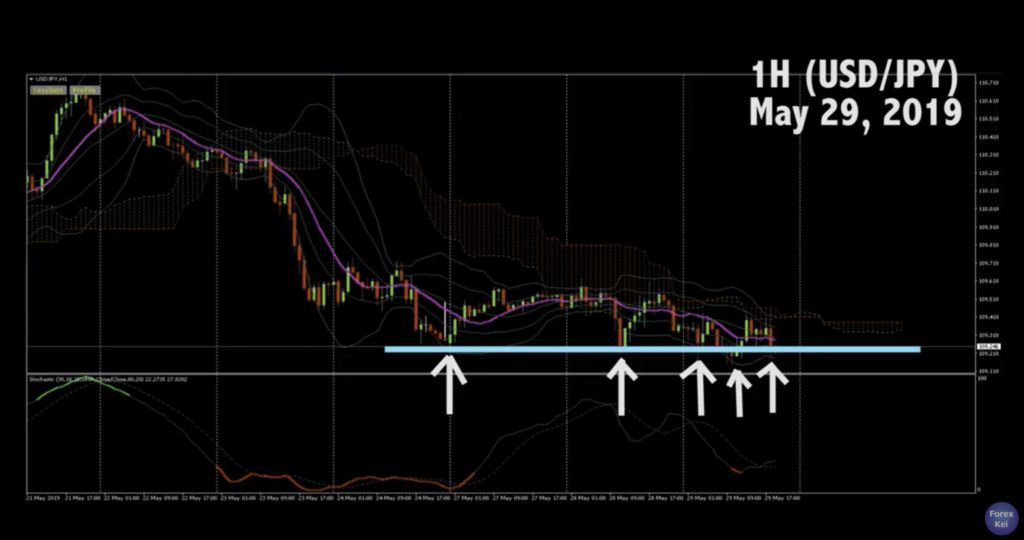
Now, when you look at the support line, the price has been supported by the recent lowest level roughly about 1, 2, 3, 4 or 5 times, so I see the support is pretty solid, and looks like there’s some strong support barrier here. And also, because the Ichimoku Cloud is becoming thinner here, the price can easily break upwards at this stage.
Now, let’s break it down and look at current 5min chart.
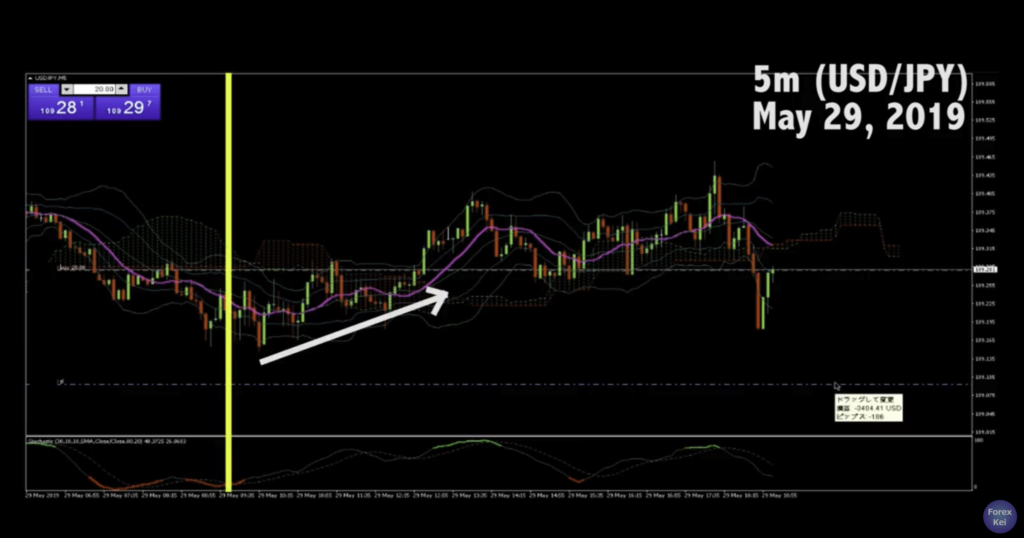
May 29 5min Chart
OK this is the current 5min chart. It’s on 29th of May on Wednesday. What I am looking for is a chance to buy. And… before I explain, let me buy here and let me explain why I place this order. The loss cut will be.. here about 18, 19 pips away from the current price.
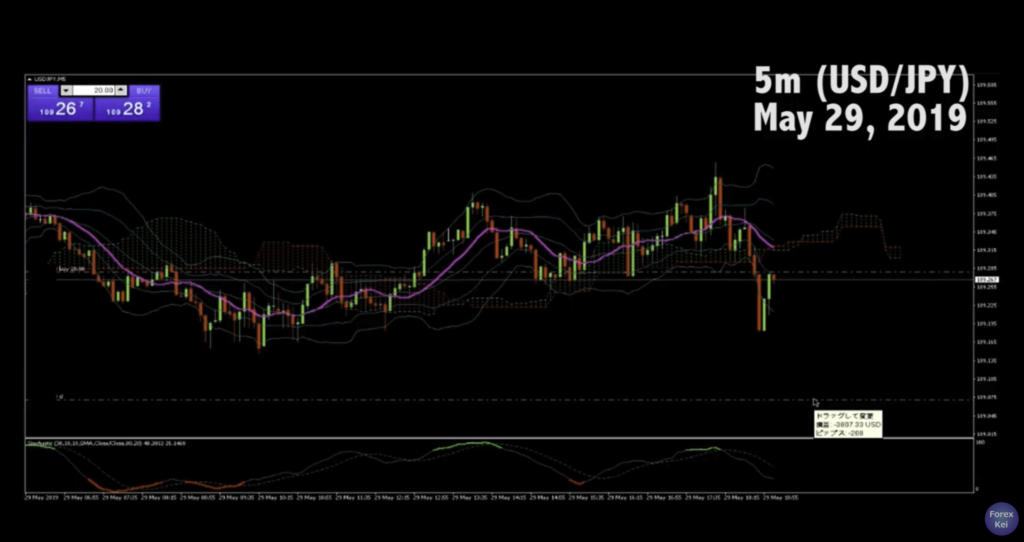
Alright, let’s look at the market’s environment.
Again, after the price marked recent low today, the price gradually moved up and in recent 30min, the price went straight down. But look at the recent lowest. It did not really touch the recent lowest, you know, the price marked lower high, then the price is moving up now.
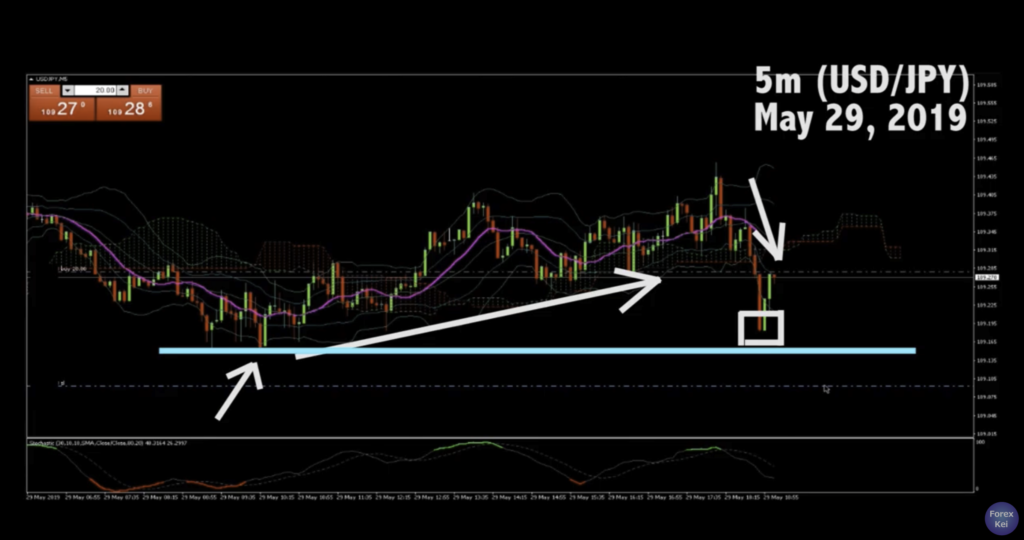
I think this is very remarkable so that’s why I just placed buy order here because I can feel the price wanting to go up. What I mean is that there’s no more, like sell energy on the market. There are more buy energy than sell energy here because another reason is that from the recent momentum, the buy is stronger than sell. If you look at the price action from the recent low, look how green candles are more showing up than red candles. So even the price went straight down recently, because it didn’t exceed the recent lowest, I wanted to buy here.
Also, another reason why I buy here is the stochastic. Is seems to be working in this environment.
When the price marked the lowest and after the stochastic marked gold cross, the price started to go up, then when it dead crossed, the price went down. Then here too, the price went up when it gold crossed, then the price went back down when it dead crossed. So what’s gonna happen when it gold crossed next time, right? It’s still not gold crossed yet but I can expect from this momentum, that when it does, the price will keep going up. And when the market doesn’t move that way, it proves the momentum has changed.
And there’s one more reason why I bought it here. That is, when the price goes down from the current level and breaks downwards, my loss is still minimum. You know, I placed the SL below like 18 or 19 pips from the current price, but I don’t think I will hold the position until the price his it because I will be keep watching the price action from now and because if the price goes below the recent lowest, then my theory is proved to be wrong. So depending on the price action as I keep watching, I might cut loss before it touches the SL.
Speaking of stop loss, I always place Stop Loss even when I can keep watching the market like today because it’s like a seatbelt, you know, whatever something unexpected happens related to this currency pair, like when some bad economic news happens or when Trump says something surprising, the price could go straight down regardless of the current momentum. It’s something unpredictable and I used to lose lots of money because of those surprises. So that’s why I make sure to put SL right after I place any orders.
And like this time, 20pips loss cut is very minimum to me and that’s why I thinks this is a great deal to buy. Sometimes, when the market’s volatility is high, I only find a place where I have to place like 50 pips or 70 pips of loss cut where I think it’s reasonable, and in that case, I would place lower lots, like 10 or even 5 lots so that I know what risk I am taking to make a certain profit.
Anyways, l will just leave it like this and let’s see how it goes later.
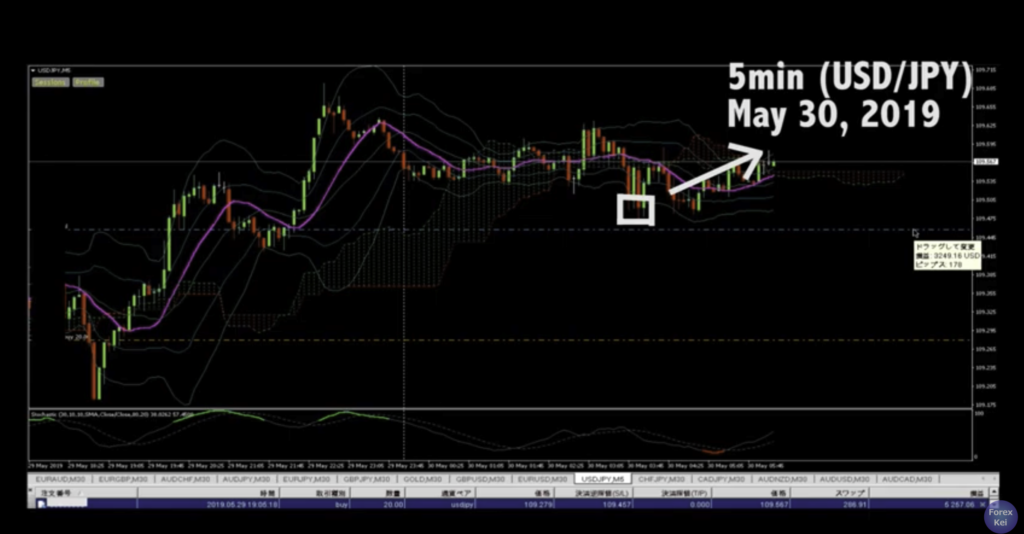
May 30 5min (10:00am JST)
Good Morning, it’s now at 10:00am in Japan on 30th of May. I was looking at the chart last night but after I confirmed the price kept going up after I placed the buy order, I went to bed. And today just woke up like 1H ago and I just had some small breakfast and took my dog for a walk, and recording this video.
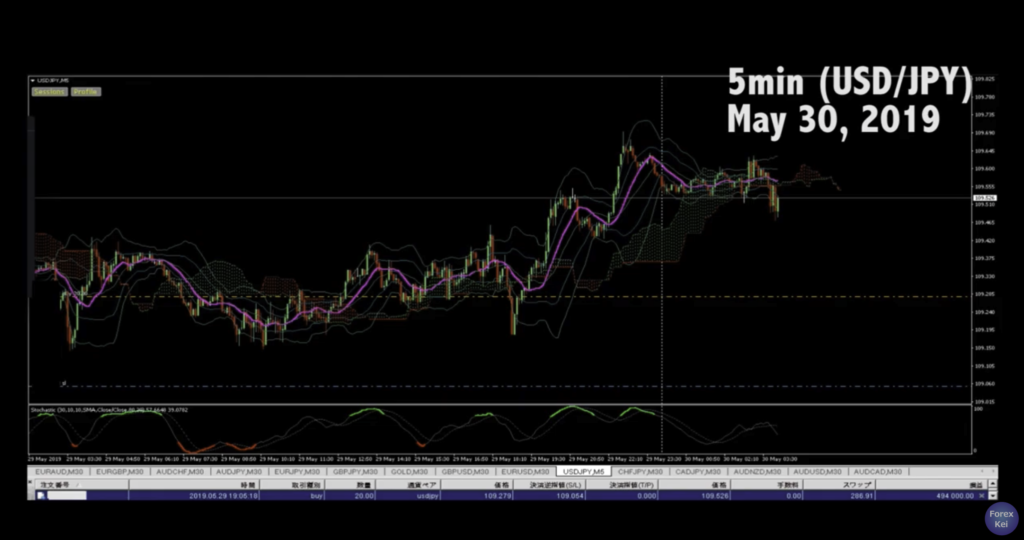
Look how nice the price went up after the entry. The price went up once, then now it’s been pushed back about 10pips from the highest level.
Now, it’s been about 27 pips above my position, and making about $5,000 of profit, I will now move the SL to the entry price so that it becomes either win or break-even game.
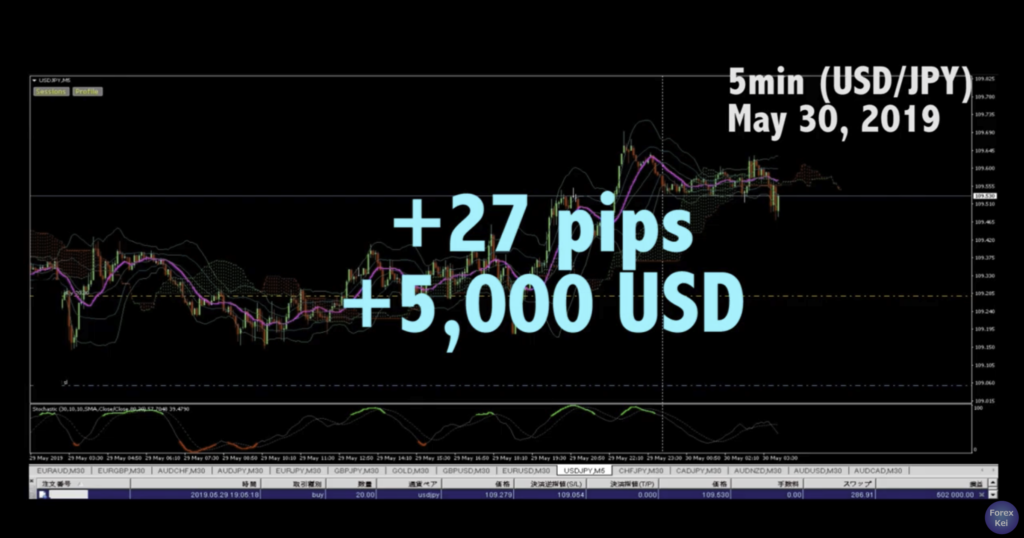
This is what I am good at and how I trade every day, make the game to either win or break, so that if I keep doing this, there’s no such a thing that “losing” the game. It’s a good deal right? I mean, who does not want the game?
Now all I can expect is how much to win, where to take profit, and this is really a fun part of trading. I will keep watching the market from this morning along with other currency pair and if I see some remarkable price actions, I will take another video.
May 30 5min (12:00 JST)
This is two hours after the previous recording.
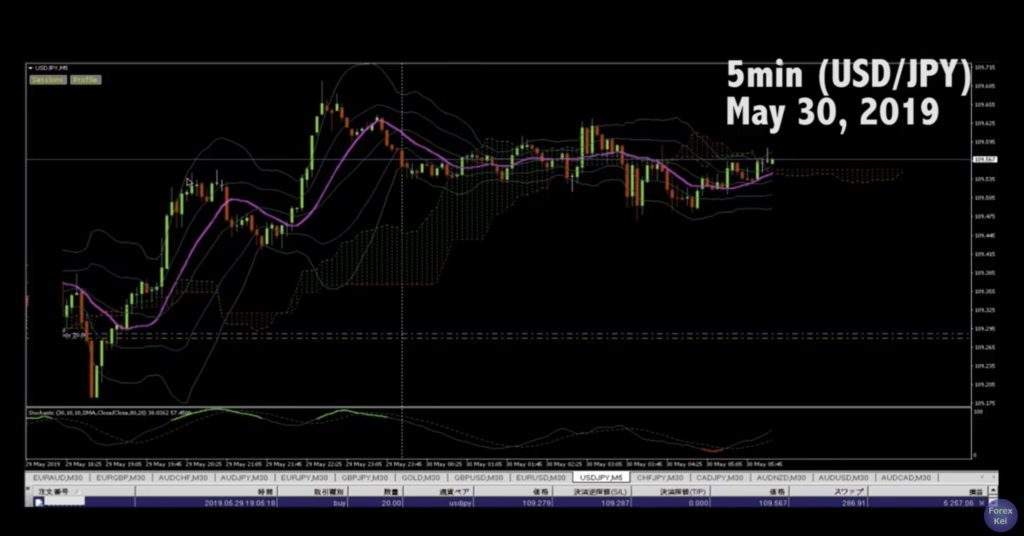
Now the price is still within the range. During Asian market, usually there’s not much of volatility. The price doesn’t break downwards but it doesn’t break upwards either. But to me, the market is still in buy momentum as the current price action shows it’s higher highs, lower highs. So I will move the stop loss to slightly below the recent lowest on this 5min chart and aim for further profit.
Now, let me explain why I moved the stop loss. First of all, what I look at is the chart pattern showing double bottom and after that price is going bullish. And if you closely look at the W bottom, the lowest price is slightly above the second recent lowest. And after it, the price keeps going up until now. Also, if you look at the stochastics, looks like it resonates with the current price action and recent lowest is right at a level below 30%, and it gold crossed. That’s I thought it’s relatively safe to move the SL to below recent lowest and if the profit is taken, I will find another trade chance so it’s ok.
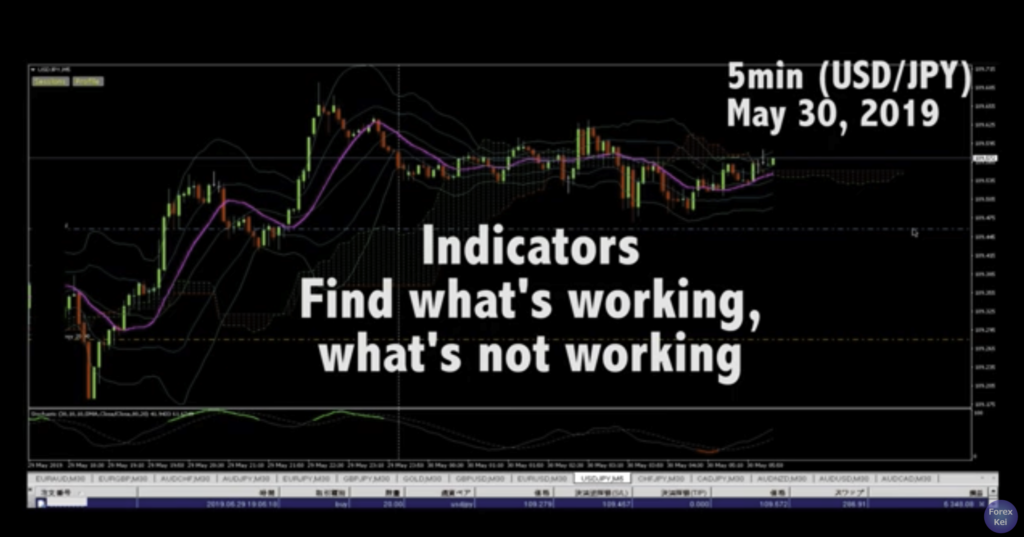
You know, one of the things that people misunderstand about indicators is that when it comes to indicators, there’s no holy grail, as you know. The important thing is to identify what’s working and what’s not in a certain time frame of the chart. For example, like on this 5min chart, it’s obvious that Ichinoku cloud is not working, right? Maybe it worked when it was on a bull trend earlier but now, cloud is too thin and it doesn’t do anything. It’s not working as a support, or resistance, or anything like that. And after the price just broke downward, it’s braking upwards. You see, the Ichinoku Cloud is very thin at a moment and when you look at it with the current price action, it’s obvious that we cannot trade with this indicator. Remember in 1H chart yesterday, it was working as a support cloud but in this chart, seems like it doesn’t so I don’t look at it. I would rather look at what’s working at a certain environment like stochastics in this case. But it’s only working on this parameter. If you change the parameter to other numbers, it will become not working, you know. but in my current setting, it’s working and this is one of my favorite settings so I just leave it like this. So, stop trying to find an indicator that works for you. But rather, for focus on what’s working and what’s not, it’s my small advise.
May 30 5m (2:00pm JST)
Ok, here is two hours after the previous recording.
Again this is 5min chart of USD/JPY on 30th of May. And just as I expected, the price kept going up and now it’s about 38 pips away from the entry price, making almost $7,000.
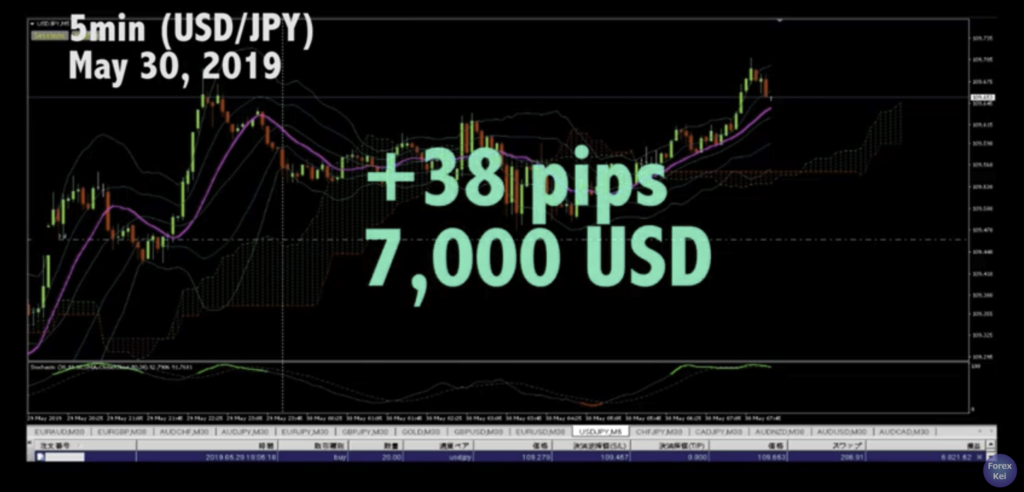
Now, if you look at the stochastics, after the previous recording, it gold crossed and now it’s above 70% level and it’s showing overbought, so I cannot tell how much more the price will extend upwards.
But if you focus on the moving average, the red line, it shows that the price is supported twice or three times, so as long as the price is above the moving average, I will just follow the trend until it breaks downwards. Now, let’s look at 1H chart and see what we can find out.
May 30 1H Chart (2:00pm JST)
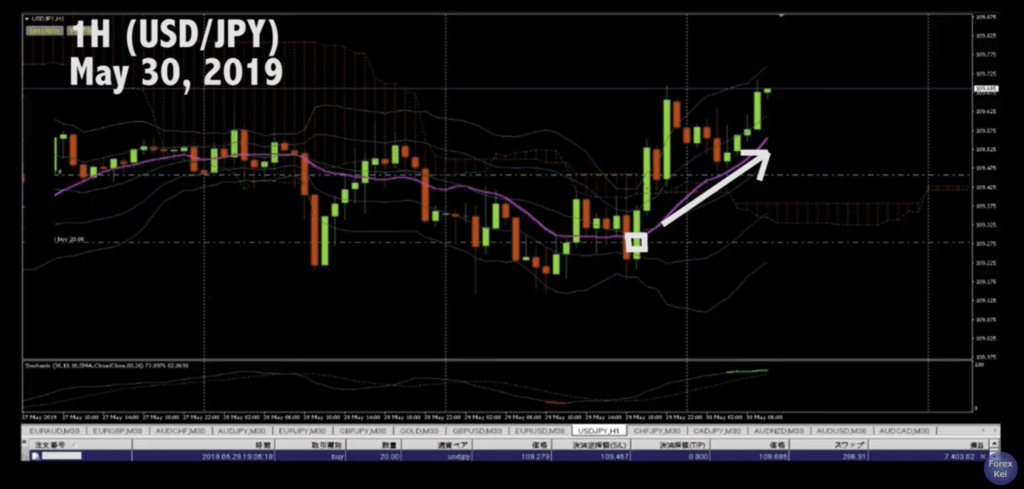
Here is 1H chart. On Thursday on 29th, I placed buy order and after that, the price went straight up, pushed back once and it keeps going up now. And I am placing my SL right below the recent lowest, ensuring about 18 pips, about $3,300 profit and currently aiming for further profit. Now if you look at the candle sticks on this 1H chart, after I placed the buy, there are two strong positive candles, and 1 negative candle showed up, then 1 strong positive candle showed up. And because it’s over bought now as you look at the stochastics, the price might come back down now. Also, because the price is hitting the previous highest so it also makes me doubtful if it breaks upwards or not.
Ichinoku cloud is not working in this 1H chart today as the cloud appears to be thin and moving horizontally. But when you look at the moving average, the current price is above the line, so there’s no reason for me to take profit at this moment unless the price breaks downwards, just like 5min chart we saw earlier.
When you look at the stochastic, it looks like it’s been working, that the price goes up where gold crossed and the price goes down when dead crossed. Now, the current price level is right above 70% level, so it might be dead crossed and if that’s the case, the price could go down. That’s something that I will be watching out along with the moving average.
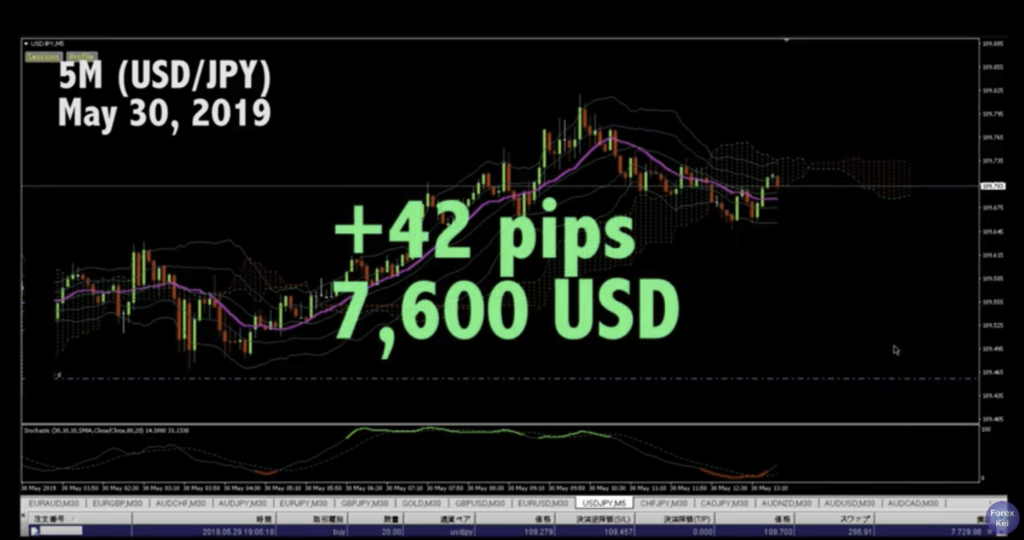
May 30 5M (7:30pm JST)
Hello, everyone. It’s at 7:30pm here in Japan. About 5 hours passed from the previous recording and this is 5min chart of USD/JPY. Now, look how the price kept going up and currently +42 pips away from my entry, making about $7,600.
And this time, I will move the SL to slightly below the recent lowest, ensuring 35 pips, about $6,400+ profit and aiming further. I kind of think that this stop loss is too tight but the reason is because I have to go out for a drink with my friends pretty soon. There is a good Yakiniku, you know, Japanese BBQ place in a city called Roppongi and that’s where I am going. It’s now 7:30pm and I will leave as soon as I finish recording this video, so I will be quick.
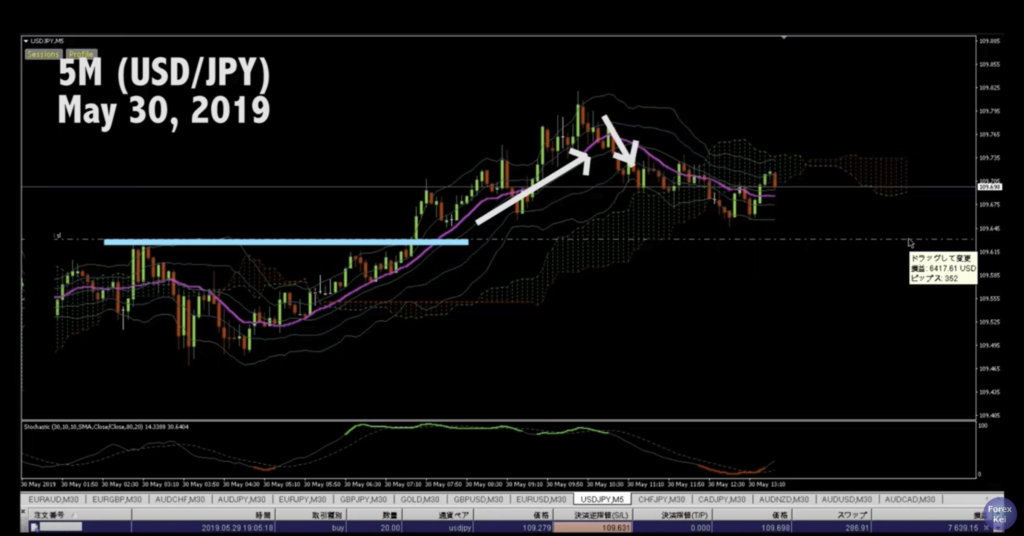
Let’s look at the price action first. After the previous recording, it broke the recent highest and the price kept going up above the Moving Average. Then the price broke the moving average downwards and looks like it’s in a range state now. If you look at the recent lowest, it marked 3 or 4 times and recently it showed like W bottom like chart pattern and now the price is on a bull trend.
Also, the price broke Ichimoku cloud downwards. Well, Ichinoku was not really working on this 5min chart so it’s not really significant.
Let’s look at something that was working, stochastics. Now it’s been oversold below 30% level, and it’s just gold crossed so the price might go up from here.
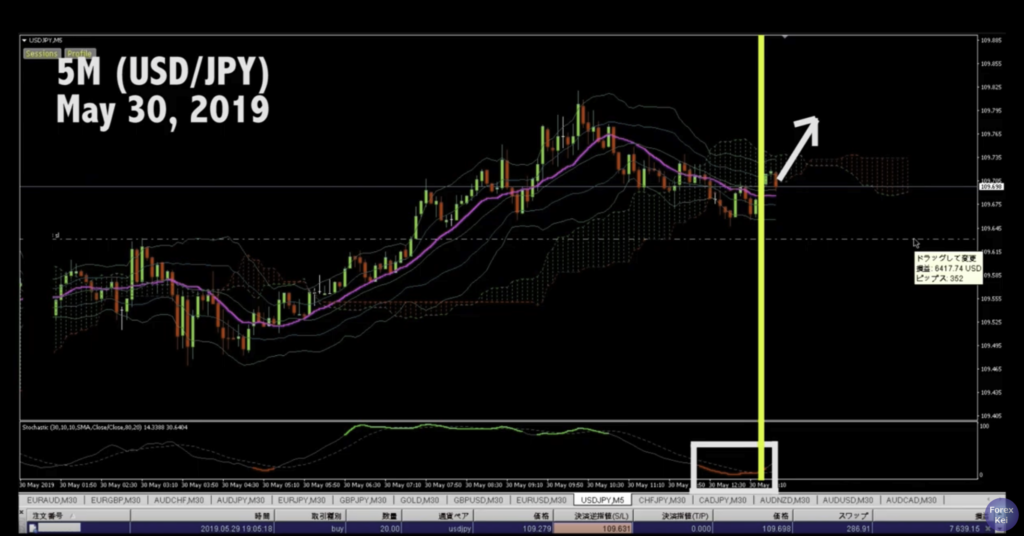
So I think it’s good to move the SL to this level and aiming for further profit.
Every time I move the stop loss, I only move it to the reasonable level where there’s a certain price action along with the indicator signals. And more importantly, it’s ok that the price hits the SL because that’s where I think it’s reasonable, and after it hits it, I just look for another chance because there are chances everyday in any currency pairs, even gold, silver, or other commodities or crypto currencies.
What I am focused is to follow my strategy and rule, and not to break it. If I break my own rule and make profits, it’s not a good profit. On the other hand, if I keep my rule and lose trading, it’s a good way of losing because I can always learn from it. So you must have your own strategy for placing order, taking profit, and cutting losses.
I guess it’s something that all the successful traders say but I think it’s true. And hopefully you can learn why by watching my live tradings.
Alright, Yakiniku and my friends are waiting for me so I gotta go!
Have a great trading this week!