
This video was recorded LIVE between 4th and 5th of June, 2019. I was looking for some trade chance on this Gold chart.
Watch Video
Daily chart
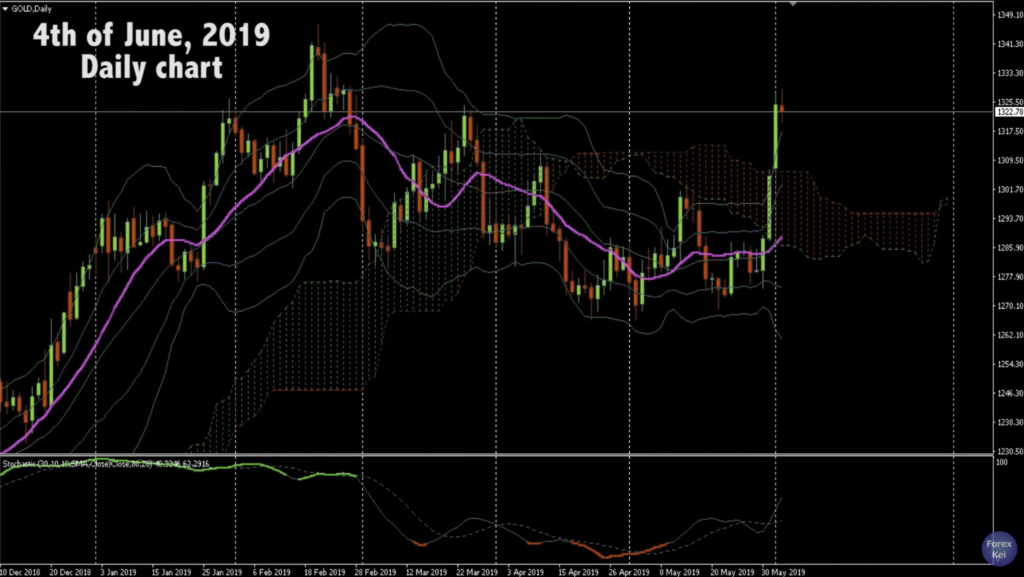
Here is the Daily chart of Gold today.
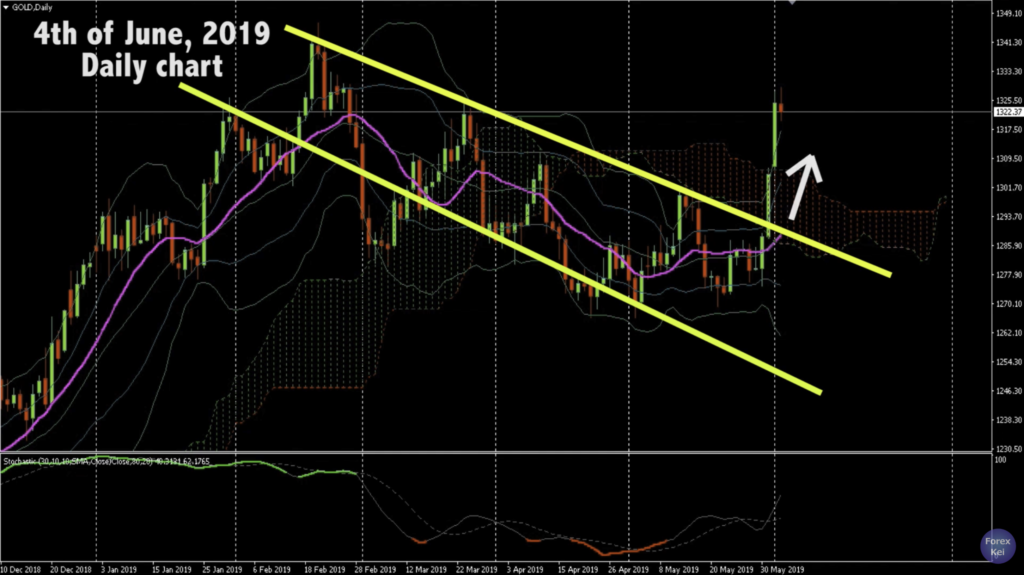
Now, as soon as I look at the chart, I noticed that there is a descending channel line and the price broke upwards like 3 days ago, and it’s been quite strong bullish trend after that and it keeps going upwards.
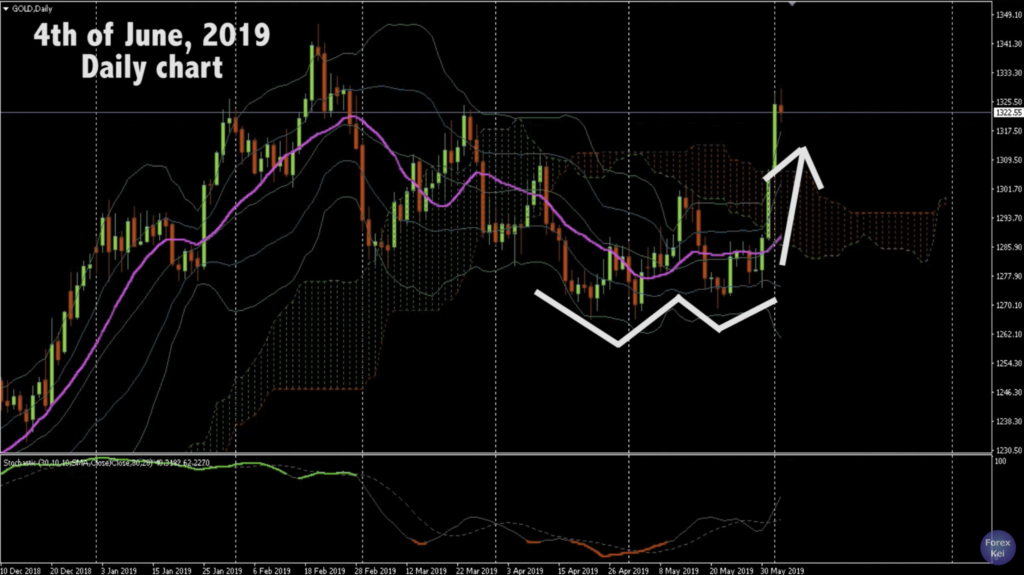
After the head and shoulder chart pattern appeared on this February, the price went downwards, then it created W bottom like chart pattern, and it went straight up and the price even broke Ichimoku cloud and keeps its bullish momentum.
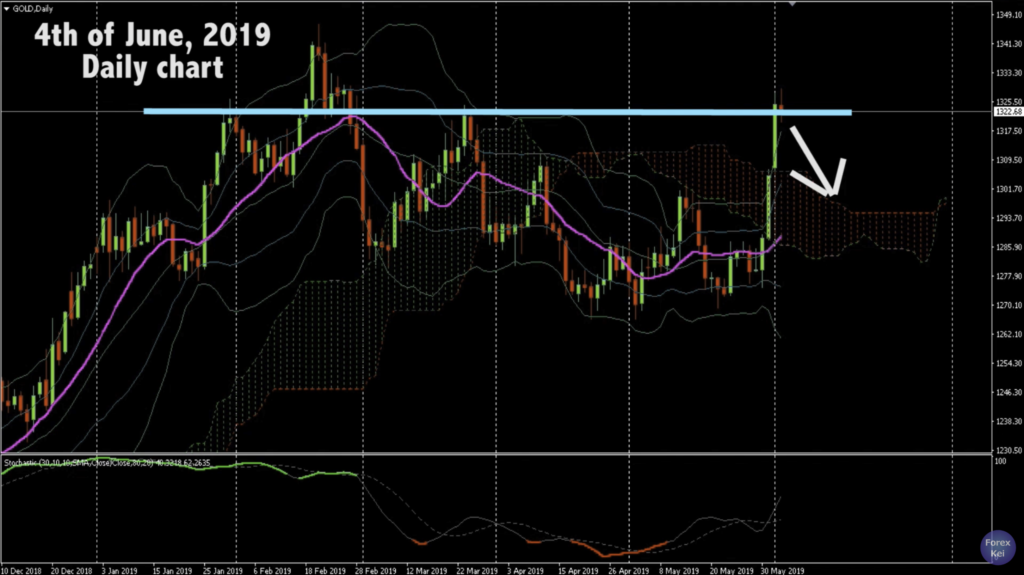
So I will look for a buy chance as I see this environment. Currently the price looks right at the previous shoulders level, so it might be resisted at the current price and possibly goes backwards.
The Stochastics does not really show a good signal, looks like it doesn’t resonate with this environment in Daily chart of Gold. It looked divergence but right now, it gold crossed because the price spiked high, and that’s something we cannot predict from this stochastics indicator.
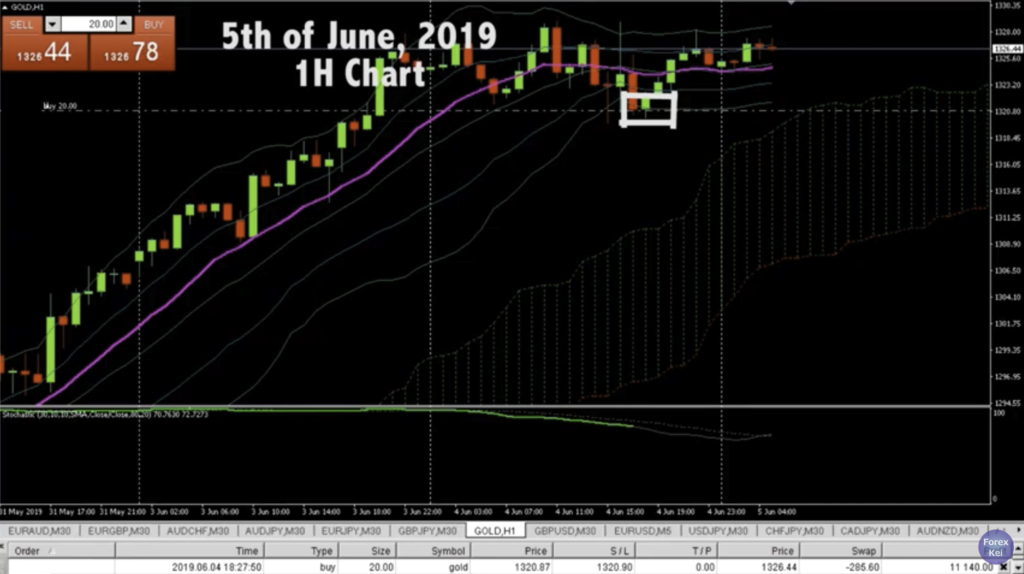
1H Chart
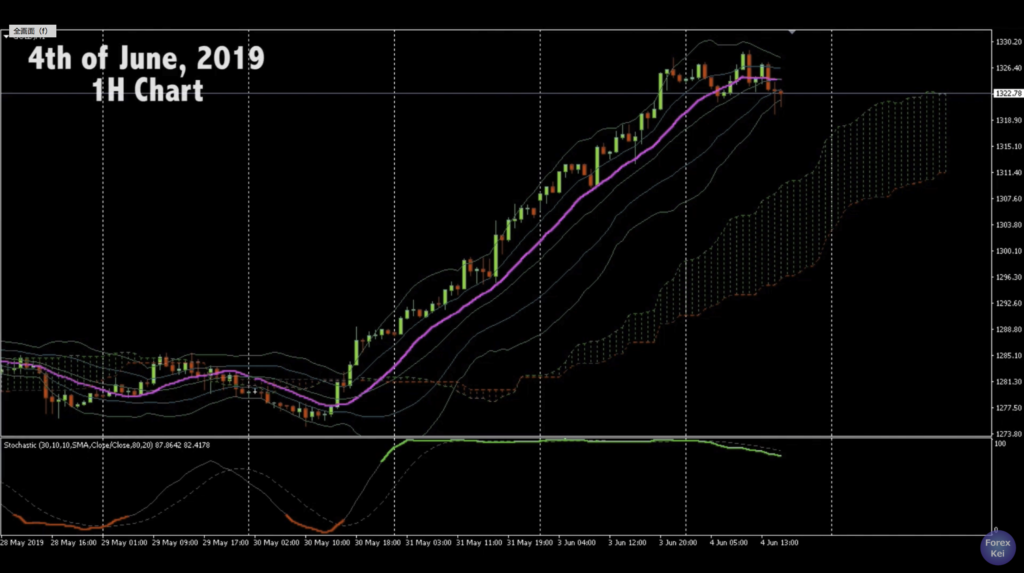
And what do we see here?
It’s been uptrend since May 30th and has been renewing the higher price since then until yesterday.
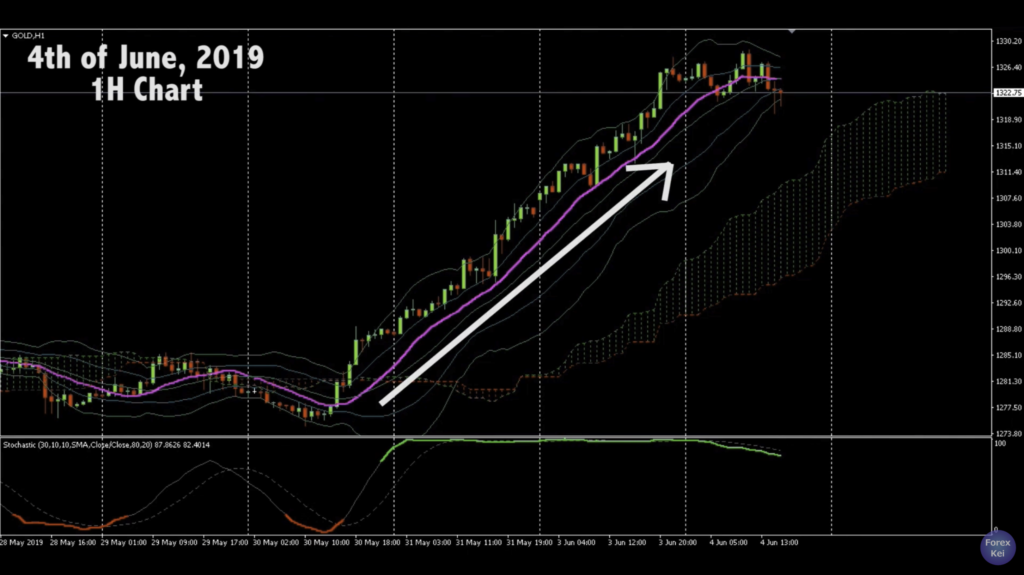
The price has been above Ichimoku cloud, and above Moving Average (the pink line) so those who bought at the lower places before May 30th, they have no reasons to take profit until today.
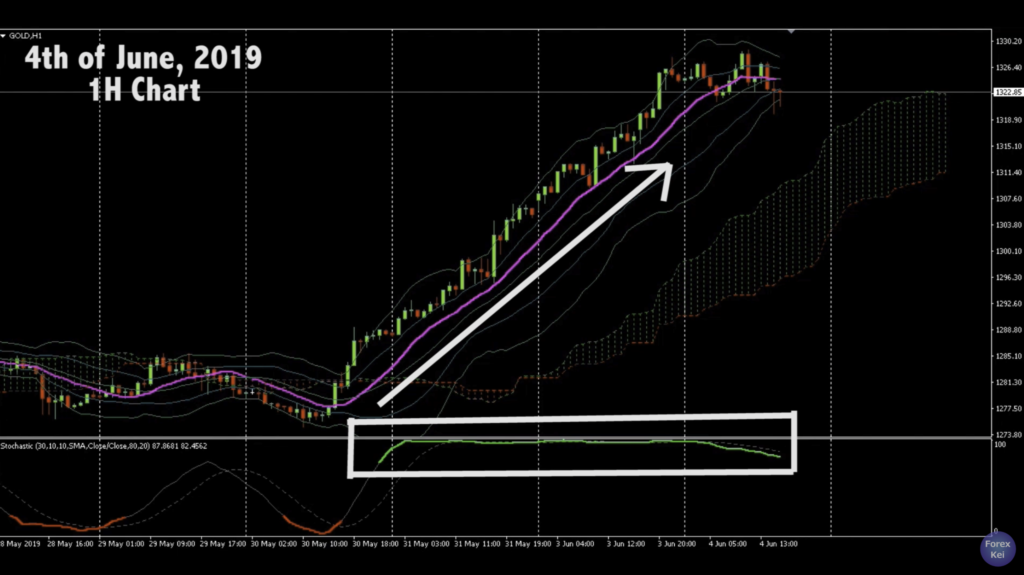
The stochastics shows it’s been overbought since May 30th and showing green, above 70% since then, so I can see that this indicator is not working in this parameter setting.
But look what’s happening today. the environment changed, right? You can see that the momentum change as the price doesn’t break recent highest anymore and it’s been creating a range today.
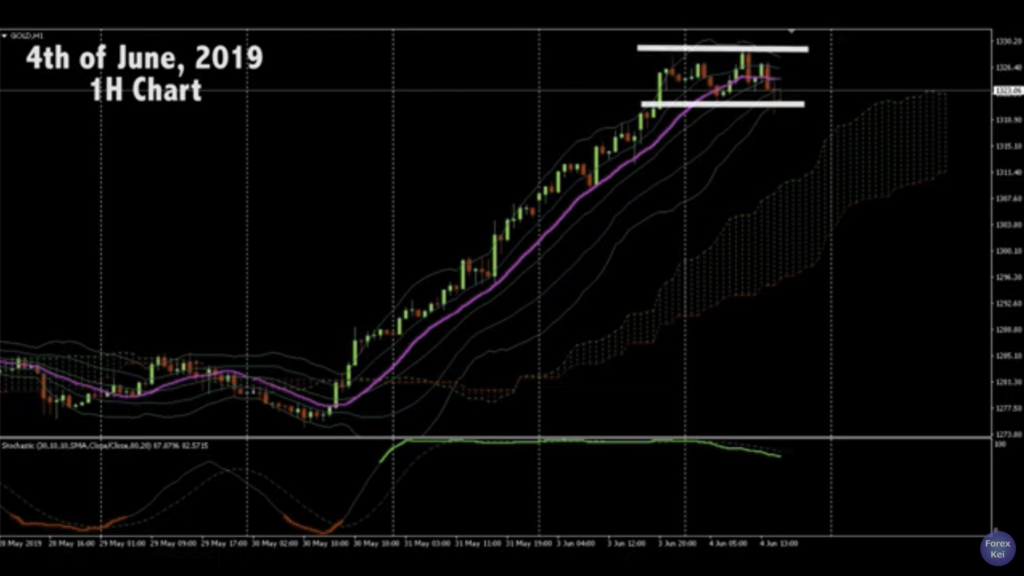
The Bollinger Band is squeezing and charging its energy for the next move, and Stochastic is going down, so the buy energy is currently stopped and the market is looking for a direction to break either upwards or downwards. However, as we saw on a Daily chart earlier, the big primary trend is still bullish, and if you look at the recent candle sticks, it shows pin bar pointing downwards, meaning there’s some barrier here that price doesn’t want to go further down.
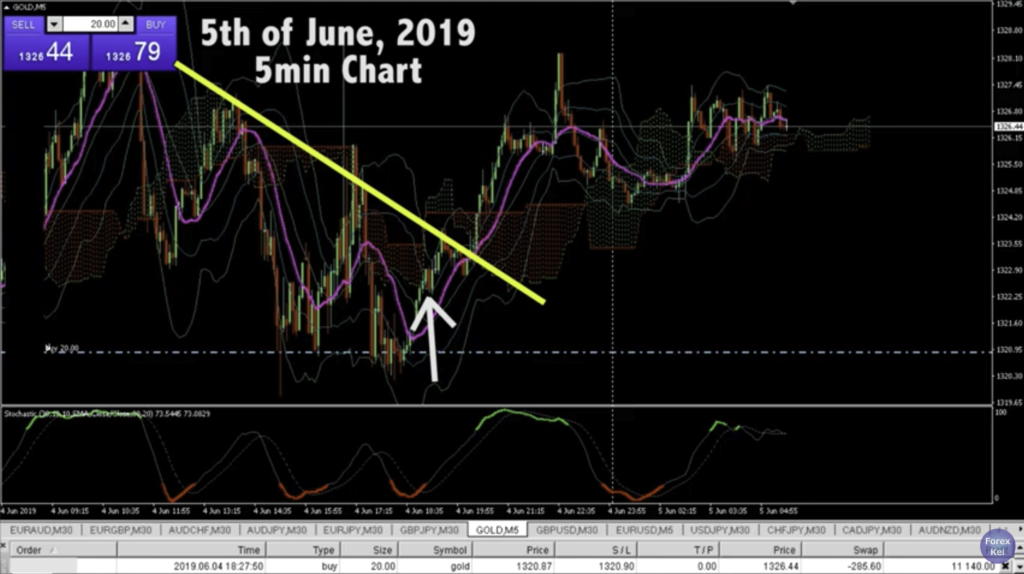
5min Chart
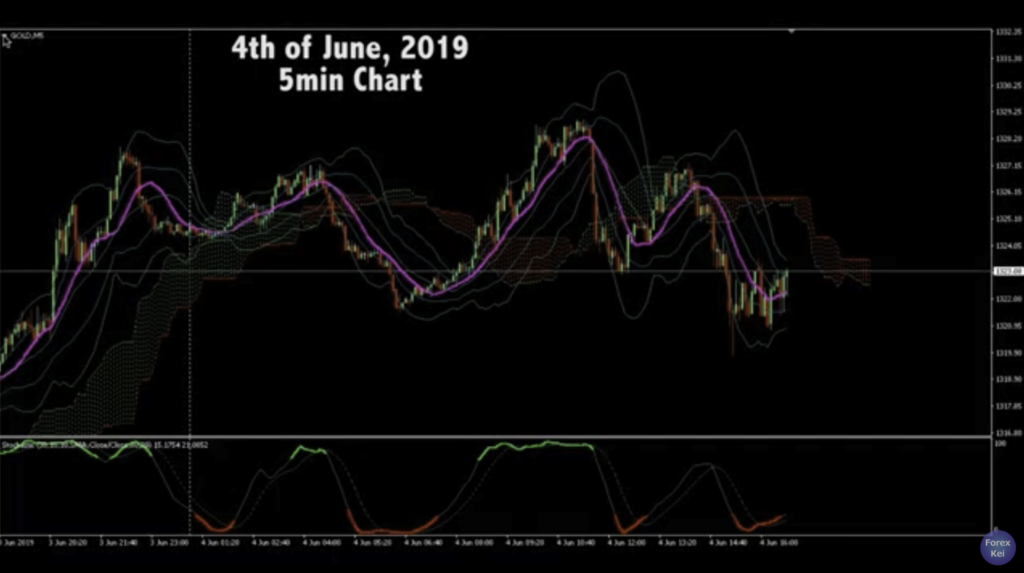
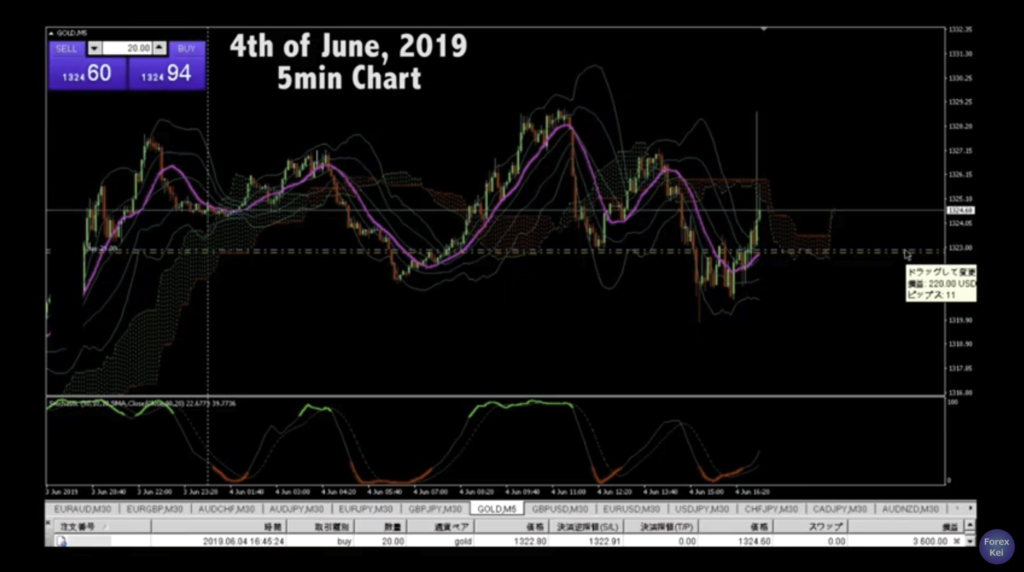
OK, this is the 5min chart of GOLD today on the 4th of June.
So, after the strong bullish trend, today it shows a complete range.
The price goes up and down but recent price action shows that there’s a firm ground here, strong support here.
Then I placed a buy place the stop loss right after the order as always. The stop loss is placed about 35 or 36 pips down from where I bought, just below the recent lowest.
So, after the continuous bullish trend, it’ just stopped today and started to create a range. When you look at a chart, you should notice these kind of differences because when the momentum changes, there’s always a trade chance. So, I placed buy here because of 3 reasons.
3 reasons why I placed a buy order
First, the Big primary tend in Daily chart is bullish so I am looking for some place to buy, and secondly, the current price level is relatively lower part of today’s range so my first target would be here, making risk, reward ratio to be 1 to like two, so it’s a good bargain sale to me.
Also the third reason is the stochastics because when you see it, it resonates the price actions in this 5min chart, like when it’s gold crossed, it goes up and when it’s dead crossed, it goes down. So I see that the Stochastics is working in this environment and now, the current price is below 30% level as it shows in red color and it’s just gold crossed, so I am expecting the price to go up to the primary target.
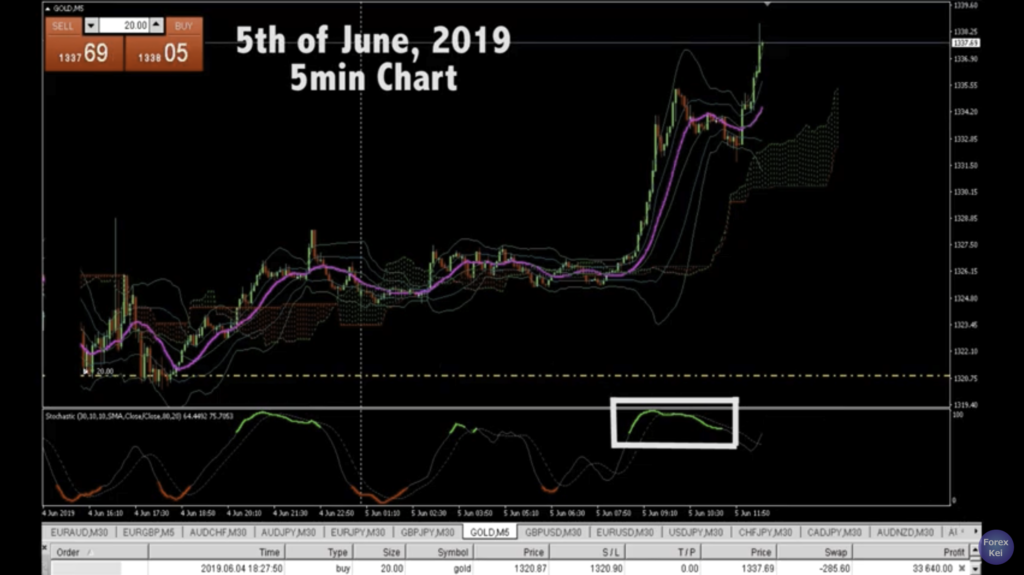
After a while, as I was talking to myself.. looks like I am getting positive results and see what’s gonna happen here.
I wanted to go to a bathroom and do some stuff while I kept recoding the video.
The price spiked upwards and came back down while recording
The price spiked up and came back down. This is definitely by some fundamental news so I will check it later but for now. And I just move the stop loss to slightly above the entry level.
The reason is because whenever this kind of sudden movement happens, the price could spike on either direction. So It’s always safe to secure the account in this kind of situation. You know, I always keep one thing in mind, it’s not to win but not to lose is way more important because then you can look for another chance but if you die, that’s it for the game, right?
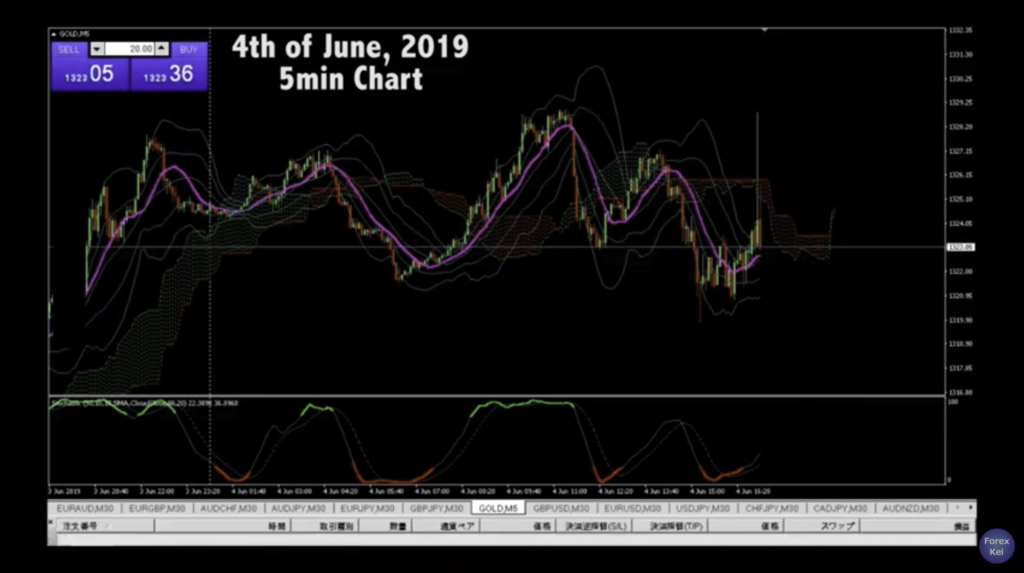
After a while, it hit the SL and I got break even. But it’s ok, I will look for another chance to buy.

The trade got break even
About 1 and a half hour later from the previous recording, this is also 5min chart but after the price hit my stop loss, look how the price kept going down and marked recent lowest.
Now when I look at this chart, I noticed one thing, it’s the price action. Like if you look at the price action before and after the spike, to me, it’s different. You know how it’s different?
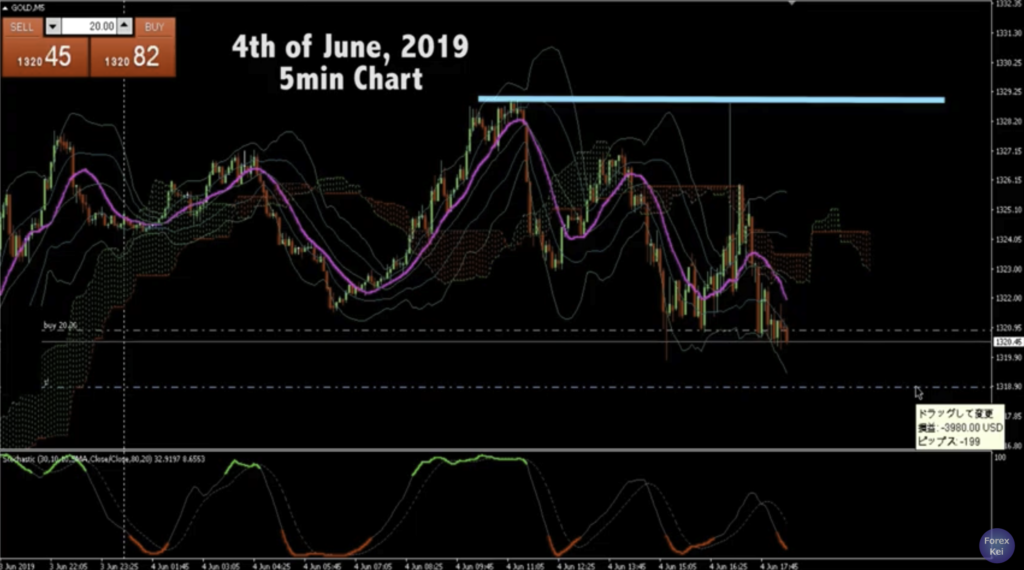
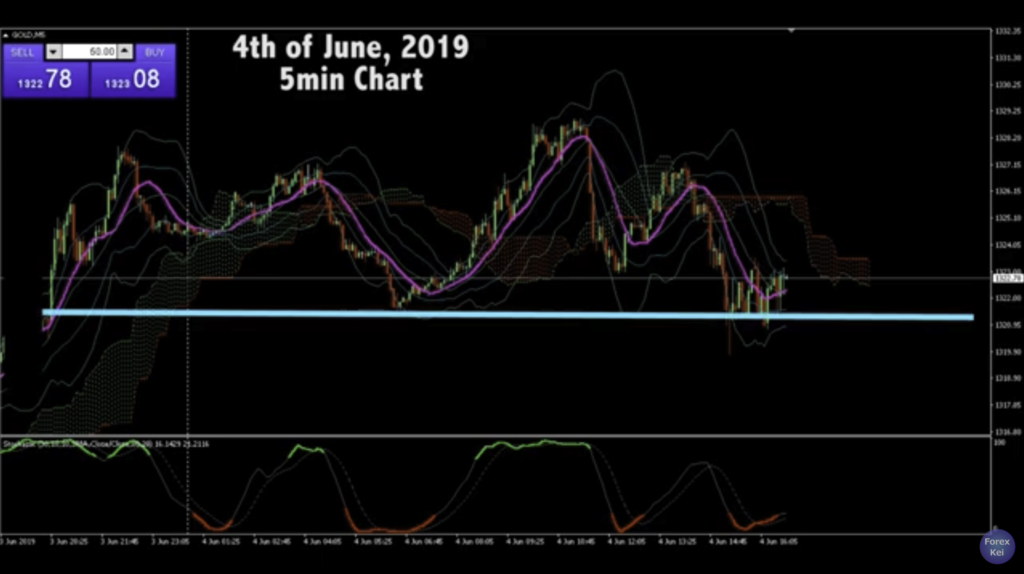
Before I explain, I just placed another buy here and place stop loss just below the previous lowest, which is about 20 pips below my entry.
Placed another buy
The first target would be the recent highest which is at the level showing in blue line, so that the risk reward ratio to be 1 to 3, which is a good game to play. OK, back to the price action. So you know how the price action is different before and after the spike?
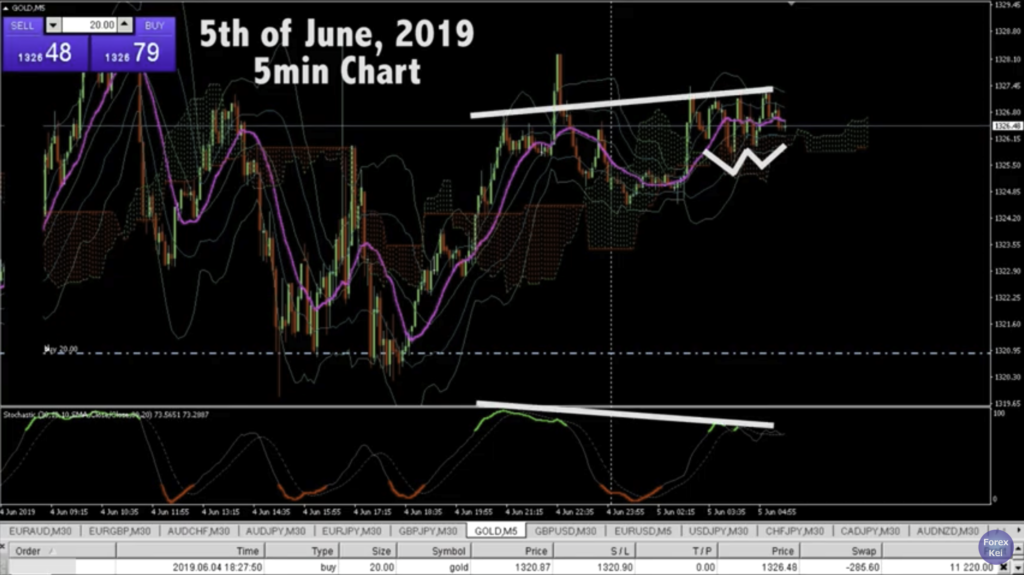
Why I placed buy: Reason 1
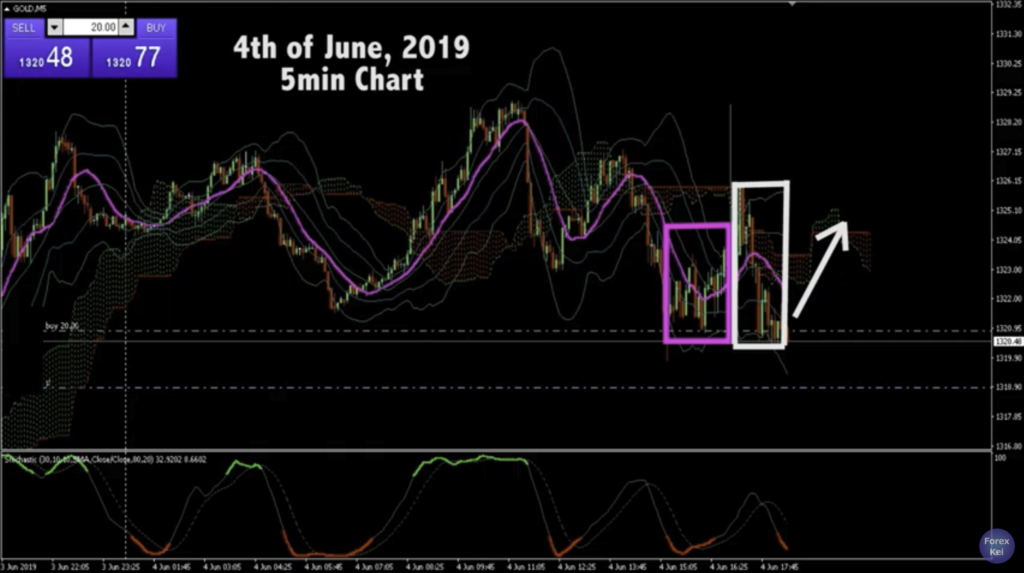
Well, when the price was going upwards, it took time. But when it goes backwards to the current price level, it didn’t take much time, it came straight back down. And whenever the movement takes less time, whenever the the price moves faster like this, there’s a higher chance that the price will go to the opposite direction, in this case, going upwards. I’ve seen lots of chart patterns like that in many currency pairs so that’s one of the possibilities.
Why I placed buy: Reason 2
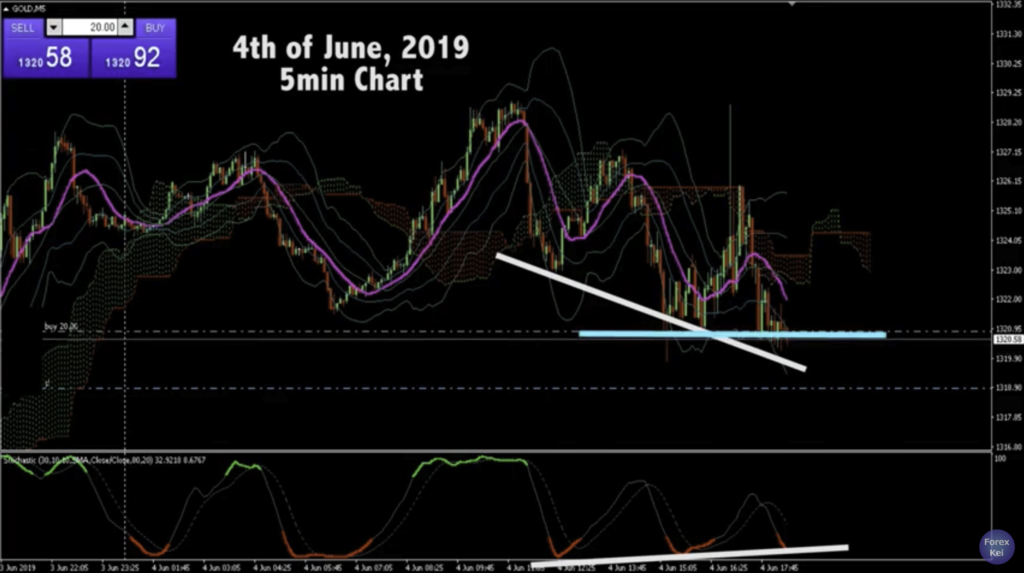
Also, another remarkable thing to look at is the divergence. You see how it’s creating divergence, where price goes lower lows and Stochastic shows lower highs? This is called divergence and it’s a sign of trend reverse. So along with the current price level that’s hitting the recent low, I think it’s a great chance to buy here. Now I’ll let the time go by and see what it’s going to be.
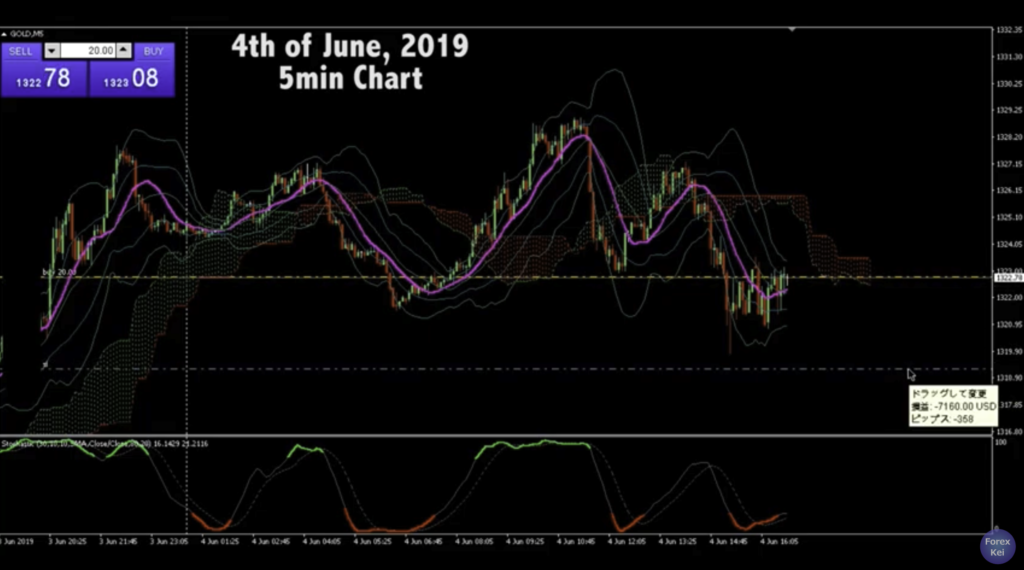
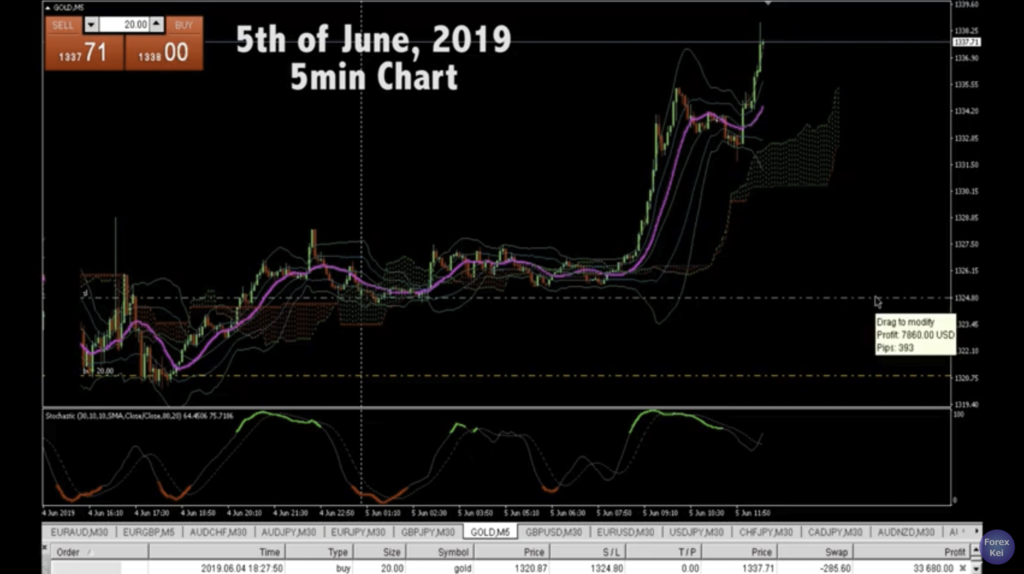
Running +20 pips, about $4,000 profit
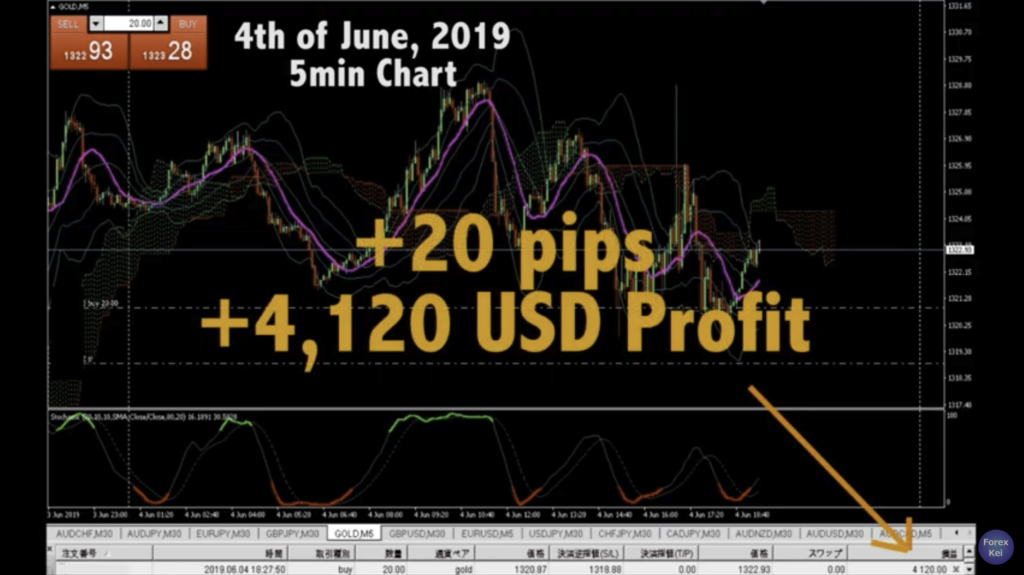
About 1 hour passed from the previous recording now and I see profit running. Now it’s like 1:30am midnight in Japan so I will go to bed anytime soon. But the price went about 20 pips from where I placed buy and running about $4,000 profit.
Now it’s clear that the price was supported at the recent lowest, stochastics is showing divergence, so I will move the stop loss right above my position so that I won’t wake up with some bad feeling with loss cut tomorrow. It’s half joking and half true and I am expecting that the price will go up and I think it will,,, but we never know.
If you see the price action, there’s a descending trend line here, so it might be resisted one more time here could go back down from this current price and get break even. But it’s ok, if that’s the case, I will look for another chance to buy or sell.
Hopefully I can show you a good result tomorrow. Until then, have a good night and sweet dreams!
Trade on 5th of June
Hello, good morning, ohayougozaimasu! This is at 11:00am on the 5th of June in Japan time. This morning after I wake up, I already confirmed with my iPhone that the profit is running so I just took a quick shower, had some breakfast, check a couple of emails, then recording this video.
1H Chart, +55 pips, $11,000 profit running
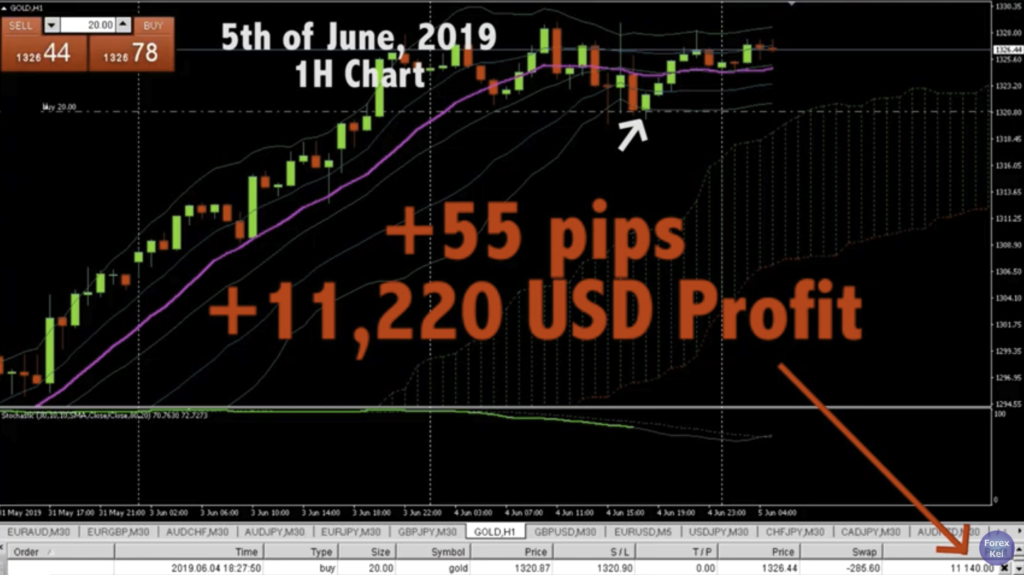
This is 1H chart of Gold on 5th of June and this is where I bought yesterday and currently running about 55 pips, running over $11,000 profit.
As you can see, I bought right at the bottom of the recent lowest, right at the bottom so I can say that this trade was beautiful and I deal as risk to reward ratio can be maximized. Now all I can expect is to keep going upwards and see what’s gonna happen.
Tonight in Japan time, There are some economic news like ADP employment change in the U.S so it might have some volatility then but for now, I am expecting the price to break upwards as the price is still over Ichimoku cloud and BB is squeezing so looks like it’s charging energy to break on either direction.
Let’s look at 5min chart and see more detailed price action.
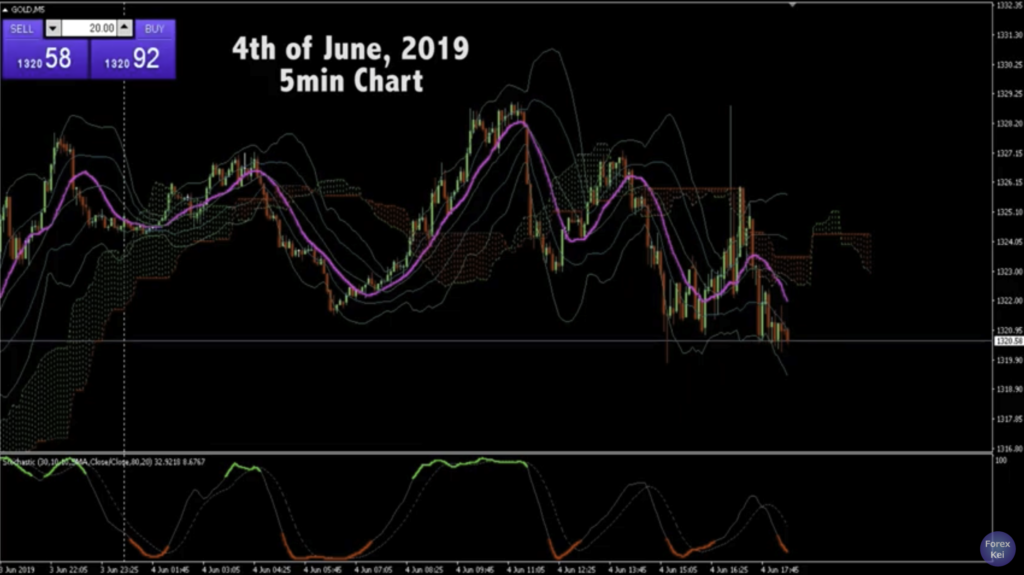
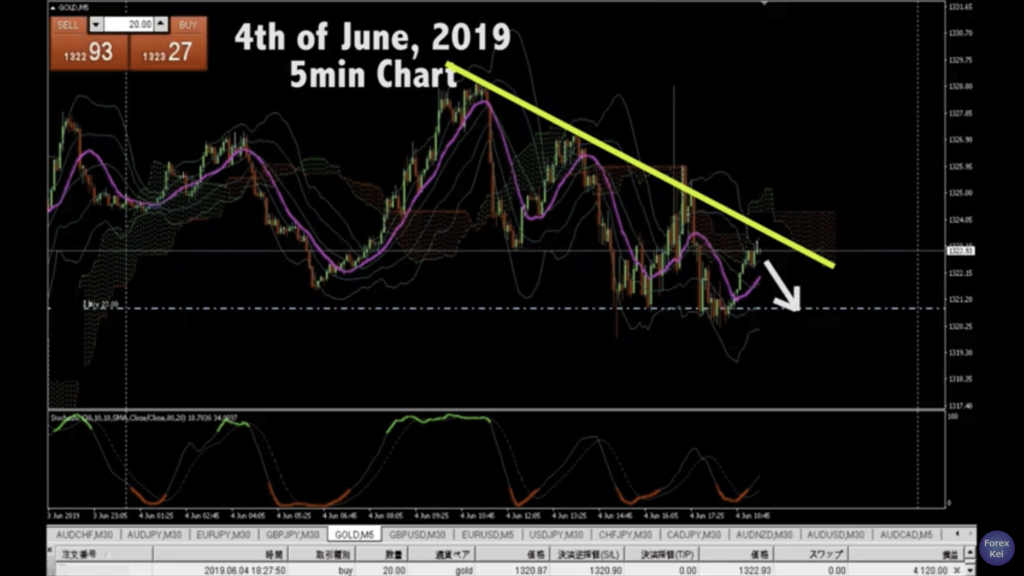
5min Chart
The arrow shows where I was on my previous recording and remember I said the price could be resisted by this yellow descending trend line? Actually it did once but it broke out upwards all the way to the recent highest level yesterday, then it wend down a little bit like 20 or 30 pips, then the price is in a range state.
Look at where the recent lowest. It shows like double bottom like chart pattern and Stochastic shows divergence. So at this stage, I still see that the trend is still in a bull trend from this 5min chart. Now it’s like 11:10am in Japan and I will be going to Yokohama today, where there’s beautiful sea port, park, and China town, so I will just leave like this because I don’t think the market won’t move during Asian time anyways.
I might report to you by Instagram, Twitter, or Facebook while I am outside, but for now, I have to get ready to go.
So I will see you tonight!
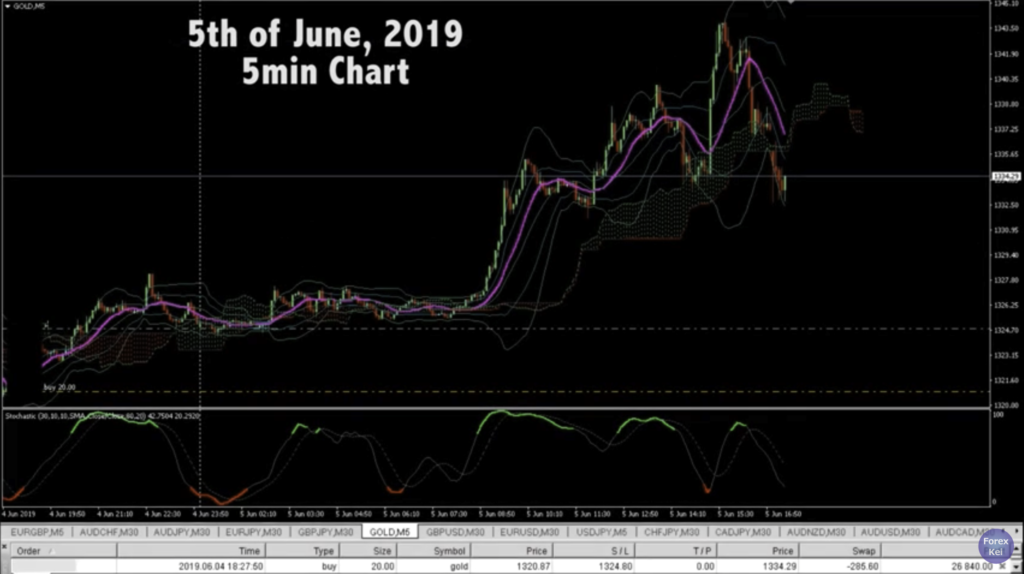
After a while, +70 pips, running $33,000 profit
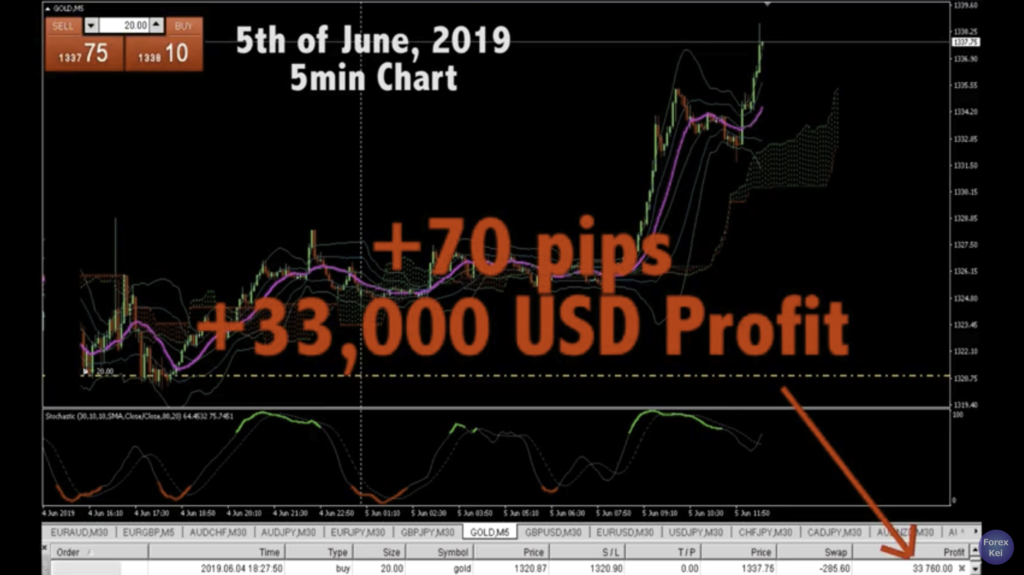
Just got back from Yokohama and came back home.
This is 5min chart but look how the price kept going up. It’s almost like 70 pips and making $33,000 profit so far. The price is breaking upwards and keeps its momentum.
And stochastic once showed overbought as it shows in green color, but after that, the price still keeps going up and looks like it’s gold crossed just now.
I still place my stop loss at the entry level so let me move it to somewhere reasonable which is this right below the recent lowest which is this place, ensuring 39 pips, $7,800 and aim for further profit. At this level, risk to reward ratio is already about 1 to 2 so it’s already a good game, but let’s see how much further I can extend the profit. As I mentioned earlier, we have some fundamental news that might affect the GOLD market, so I will keep paying attention to it.
After 5 hours, the price came back down
5 hours passed after the previous recording. and again this is 5min chart of Gold on the 5th of June. Now the price came back downwards and it’s strong. The volatility is pretty high today.
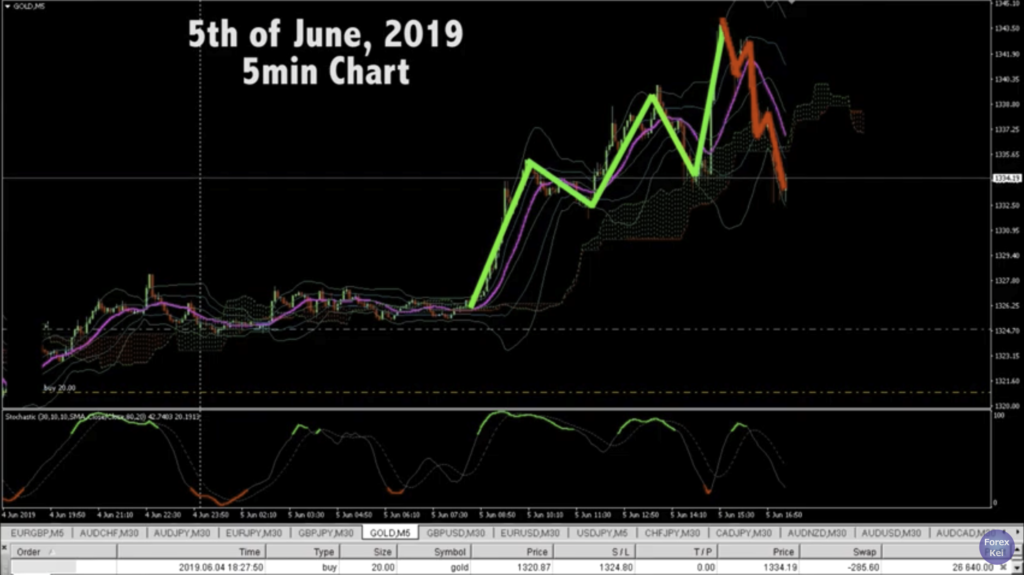
If you look at the price action, after it made 5 waves upwards, it’s creating downward waves of 5 waves. And the price is near the recent lowest, so the price might be supported here and could come back up this way.
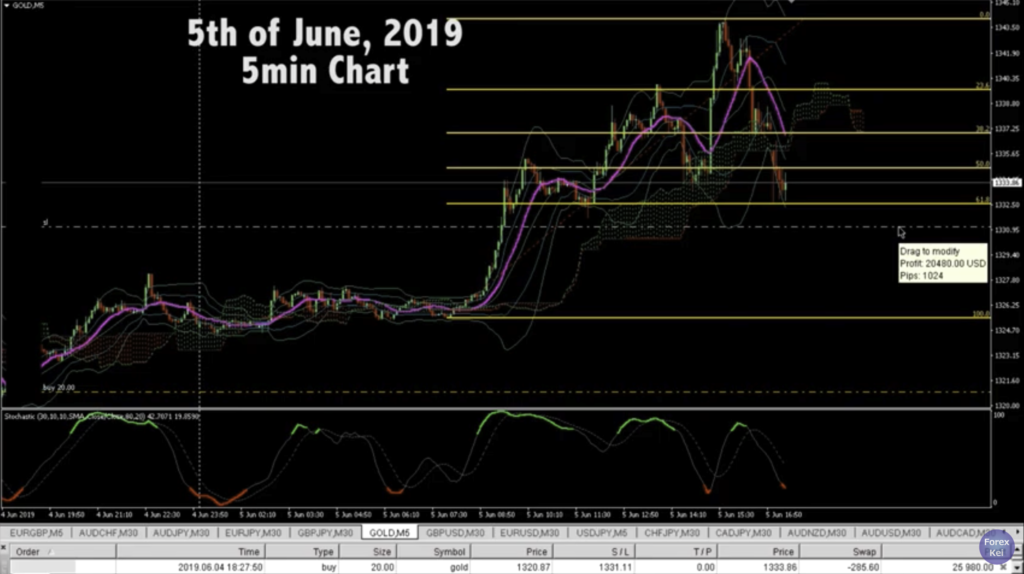
If I put the fibonacci retracement between the recent lowest and recent highest, the price is right at 61.8% so I moved the stop loss, or now you can call it take profit line, I moved it slightly below this 61.8% level. It’s 102 pips, ensuring $20,480 USD and aim for further profit. I think this is quite reasonable to place the profit line here because of the fibonacci retracement and support line, and this is ok for now. If the price breaks this line downwards, that means the whole environment has changed so it’s ok, I will let the profit be taken.
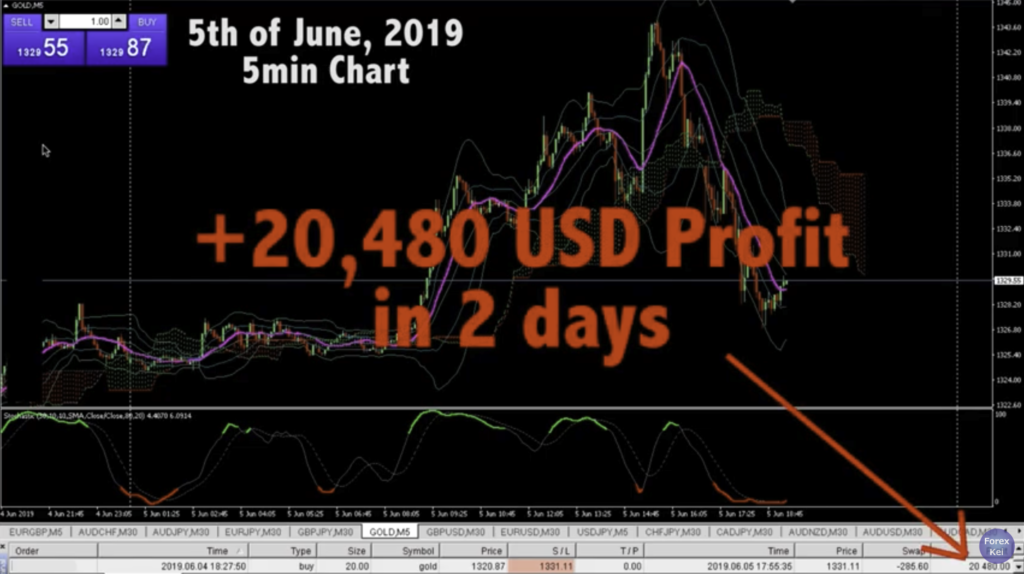
Profit was taken, got $20,480 in 2 days!
Hello, right now, it’s 1:20am in Japan time in a midnight and when I opened the chart, the profit was taken while I was watching some Anime. So, the price was not supported and it just broke downwards. So the next scenario might be either the price goes up after it reaches the recent lowest, or it continues to break downwards and still continue to create a range in 1H chart. That’s something that no one knows and it’s uncontrollable. The only thing we can control is where to buy or sell, where to place stop loss and when to take profit, right? All the other things belong to the market and it’s something unpredictable.
But I took a profit of a little over $20,000 so I won the game and it’s ok.
The trade was Risk 1: Reward 5
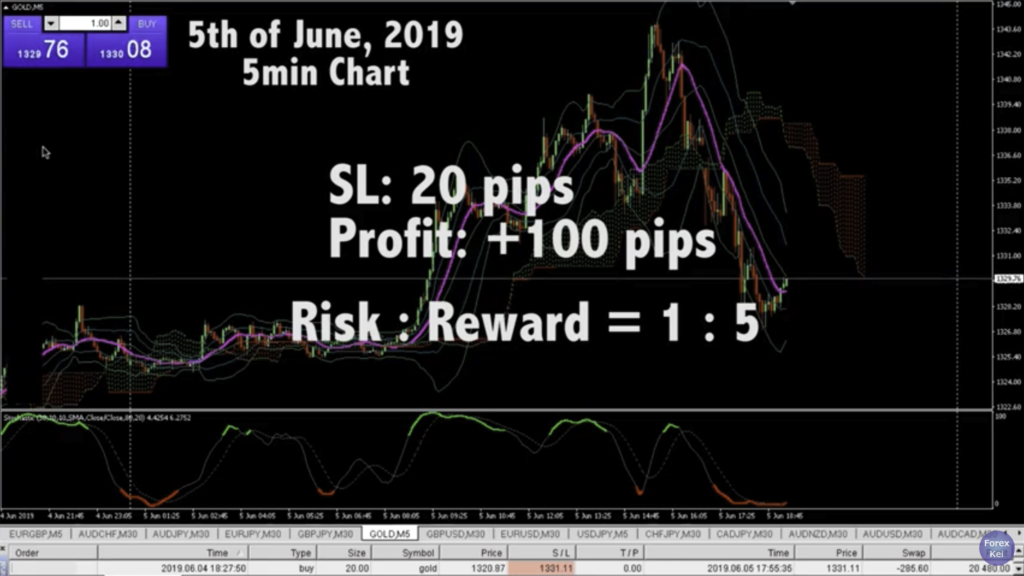
And as the history shows, I placed the buy at 1302.87 and placed stop loss 20 pips below. and I took profit at 1331.11 so how many pips did I get? The reward is about 100 pips so what was the risk reward ratio of the trade?
The risk was 20 pips and I got 100 pips so it was 1:5 ratio. So I can say that it was a beautiful trade.
Whenever you try to place orders, always, always look for a place where there’s relatively more advantage. Don’t place an order in a middle of the range or just by your instinct, but keep looking for a place that you have more advantage like this, then you can make profits out of this zero-sum game in a very stable way.
Actually, I am thinking to record a video about risk reward ratio and why it’s more important than winning rate, maybe during this weekend some time, so stay tuned. I will put the link on the description below so that you can have easier access to the video.
Thank you for reading the article!
Thank you for reading the article!
Please press a good button on Youtube and subscribe for my future videos and Live Trades!
Cheers,