
This is the review of a trade I got from one of my followers in terms of both technical and mental awareness in forex trading.
Watch Video
Mail from Patrick in Canada
Hello Kei san. Thank you for the great videos. I learn a lot and wish I could trade like you someday.
I started trading like half a year ago but still struggling. I tend to see and trade by small timeframe charts so that I get the most profit possible from very top to bottom or vise versa.
But as you told in a video, I think I should look at a bigger timeframe first to see a bigger picture and create own scenario… and now I realize it’s true but I feel when I have that bias, it’s so hard to get out of it and struggle for a long time. I feel I was dumb..
But from now, I trade along with the trend in a bigger time frame, then break it down to smaller timeframe.
Let me share with you one of my trades and let me know if you think I did something wrong.
After a while I got some profit but I was not able to identify the trend reverse signal after I noticed the W bottom, so I should have taken profit before I confirm this.
That way I was gonna get more profit.
Also, another point was I couldn’t wait long enough to confirm the price breaking 20MA downwards.
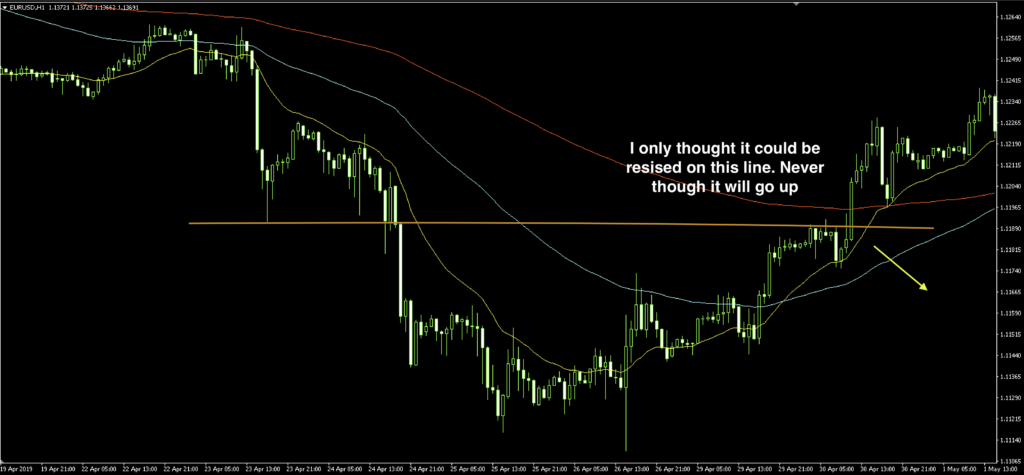
30/04/2019 EURUSD (when he placed short)
H4
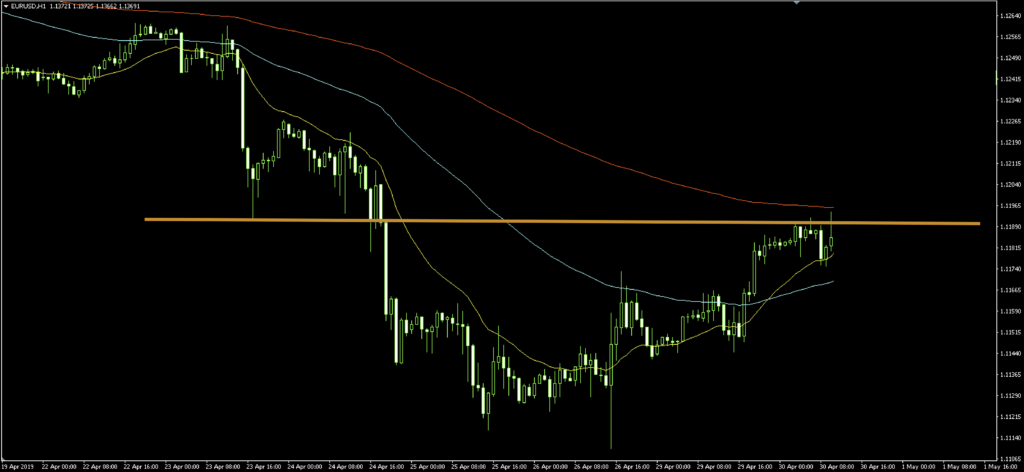
The price went down, then supported and it’s on bullish trend, breaking 20MA upwards, and now the price is in a range at around rate of 1.1189.
H1
20MA gold crossed 75MA, and the price is resisted by the orange horizontal line.
M5
Head and shoulder pattern is confirmed. 20MA is pointing downwards and about to dead cross the 75MA.
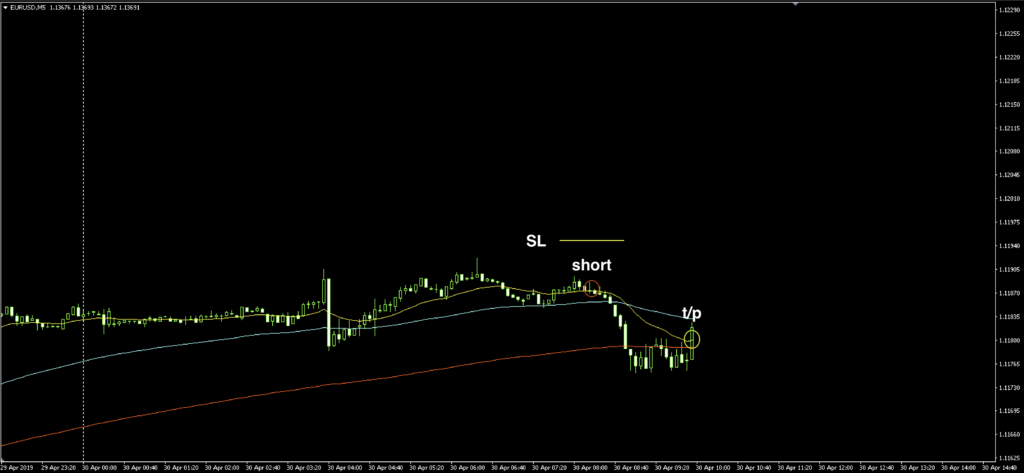
He placed short and SL above the previous highest. And he took profit after confirming W bottom chart pattern.
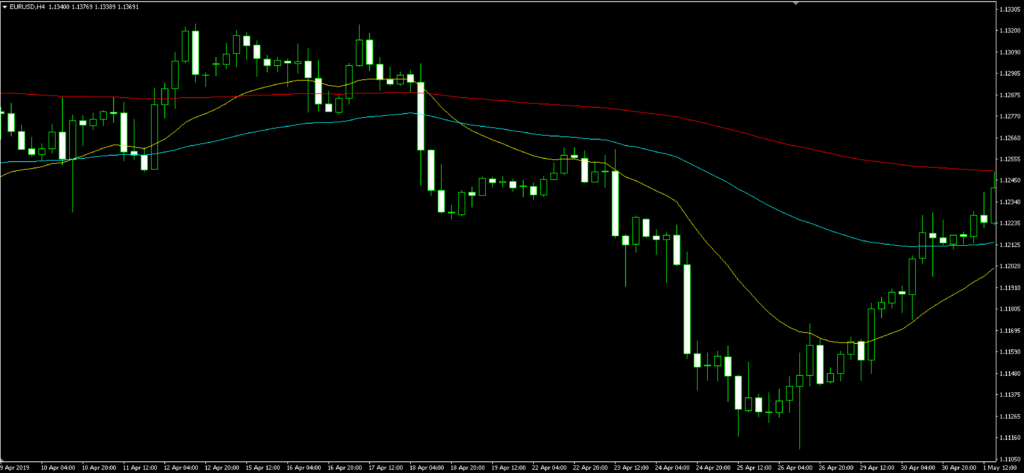
30/04/2019 EURUSD (what happened afterwards)
H4
H1
M5
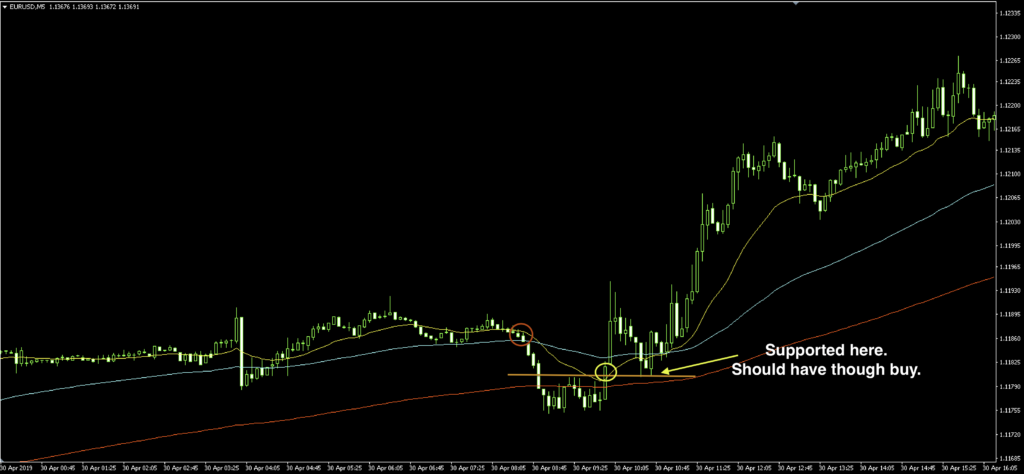
In M5 chart, the price was supported by the neck line and it kept going up afterwards. He was only expecting the price to go down so it became regretful for him as he was not able to take all these bullish pips, although he took 7 pips of profit…
Kei’s view
Here is my view and explanation.
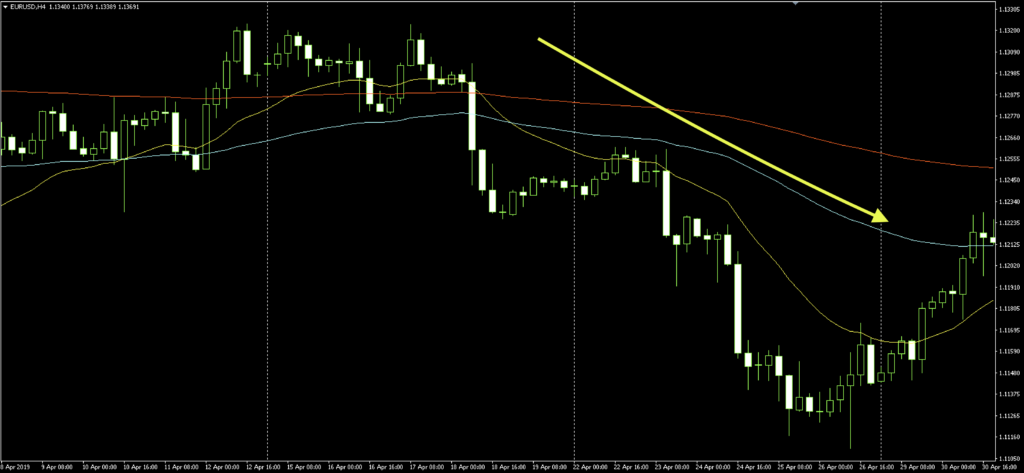
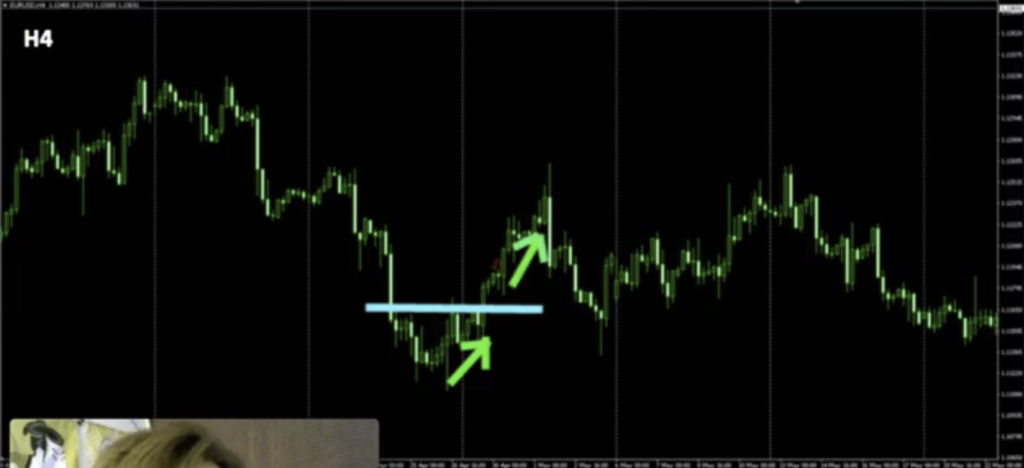
H4
After the recent bearish trend, the price went up once towards the recent resistance line, and it broke upwards and kept on moving up.
H1
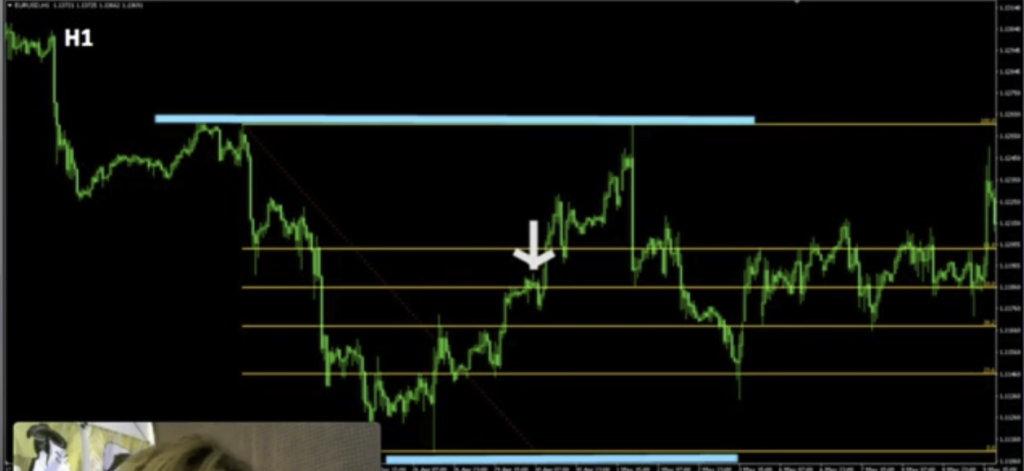
The arrow pointing down is where Patrick placed short, but notice it’s on a bullish trend as you can draw a channel line.
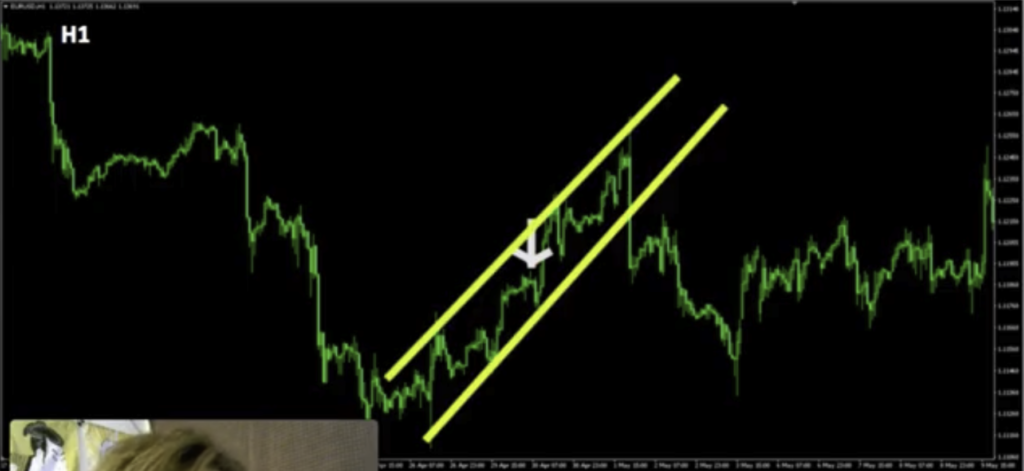
Plus, if you draw Fibonacci retracement between recent lowest and recent highest on this H1 chart, where he traded was right at 50% half price return. So the price could be resisted here and come back down.
Now, there are 3 things I wanted to mention from his trade.
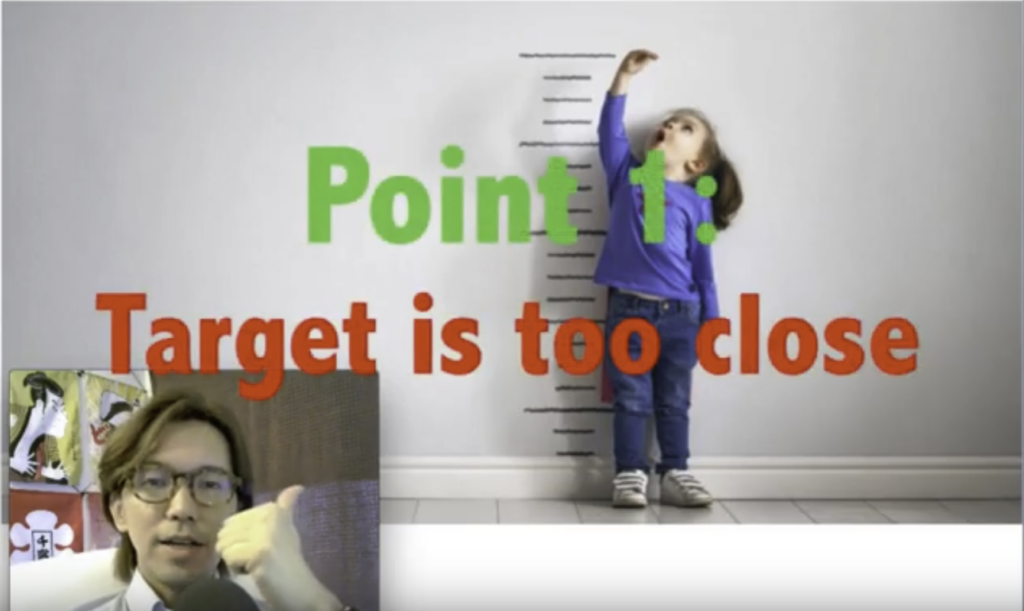
1. The target is too close
M5
He said the following.
It could possible to go up after the short. but considering risk reward, I thought it’s great because the initial target was on 200MA.
Now, there is only like 7 or 8 pips to 200MA.
If he gets used to this kind of trading, he only aims for small pips.
If the average earning pips is only like 5 pips, when he gets 20 pips of loss, his mental will be crushed because he knows how hard it is to win that back.
And the effort on 1 single trade is the same no matter if it’s 5 pips or 50 pips. A good lawyer earns like $800 or even $1,000 hourly but you as a forex trader can increase the value on 1 single trade by aiming for longer pips so that you earn bigger in 1 trade. Becoming a forex trader does not require anything unlike lawyers, so it’s something that you can start now.
There are several trading styles, like swing, day, or scalping but if you are a day trader, you can aim for at least 10 pips, ideally 20 pips for 1 trade so that your fear of loss cut will be decreased and you will get more confidence over time.
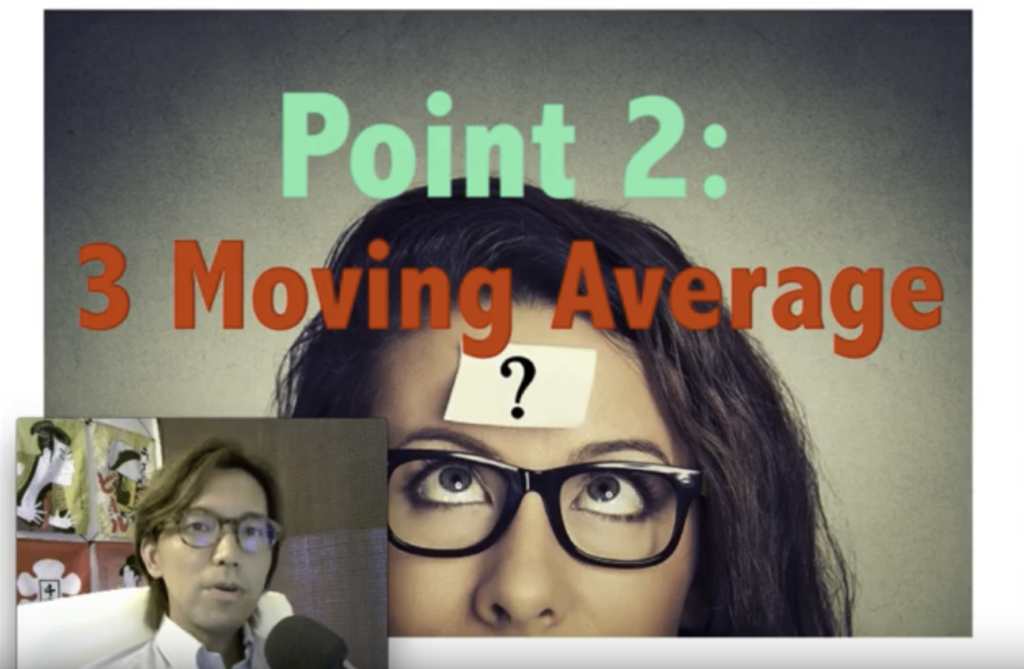
2. Are 3 Moving Averages really necessary for trading?
I placed short on the red circle, might be too early because the price was not still breaking the 20MA down, but it actually kept going down and broke 200MA downwards, then it stopped dropping.
Most of the indicators, including the moving average, are invented based on Daily chart.
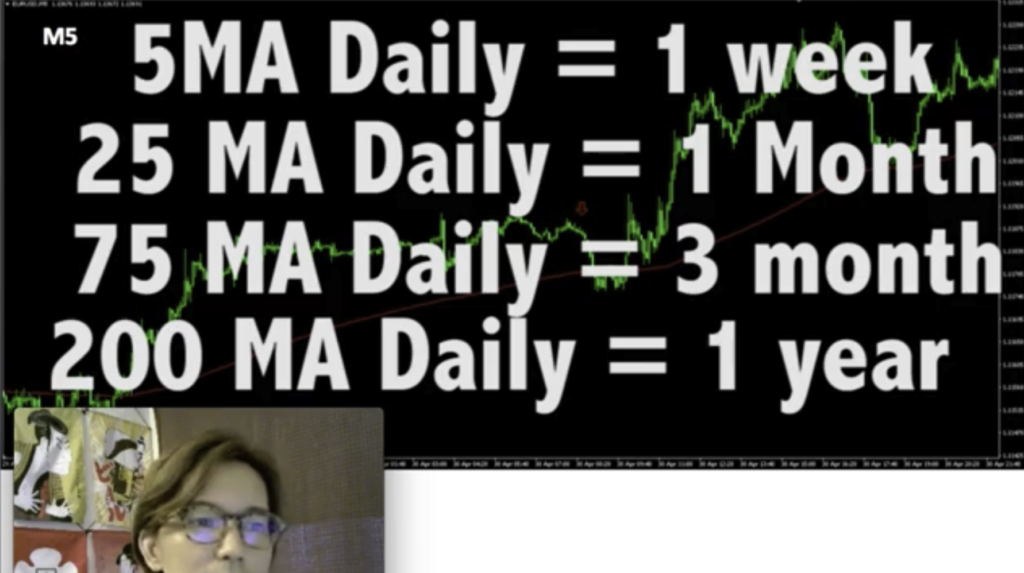
5MA is for the past 1 week, 25MA is for the past 1 month, 75MA for the past 3 month, and 200MA for the past 1 year. Therefore, there are relatively more traders who look at 200MA in daily chart.
And the market is basically under control of Daily chart. Any timeframe below Daily charts are under control of this Daily chart.
What H4 chart’s trend blocks is Daily resistance and support lines. And it’s up to Daily chart how the market on H4 chart will be.
And the same thing can be said in any timeframe. Even if you look and analyze the M15 chart, no matter how long you put your effort to look into it, if you don’t look at H1 chart, you never understand how M15 will move.
Back to the MAs.
I wonder how many traders would look at the 200MA in M5 chart.
Instead of 200MA, it’s better to look at the timeframe above M15, which is H1 and see what’s gonna happen because it’s more reliable, because it’s up to H1 how the price will move after all.
I sometimes trade based on the MA if it’s working.
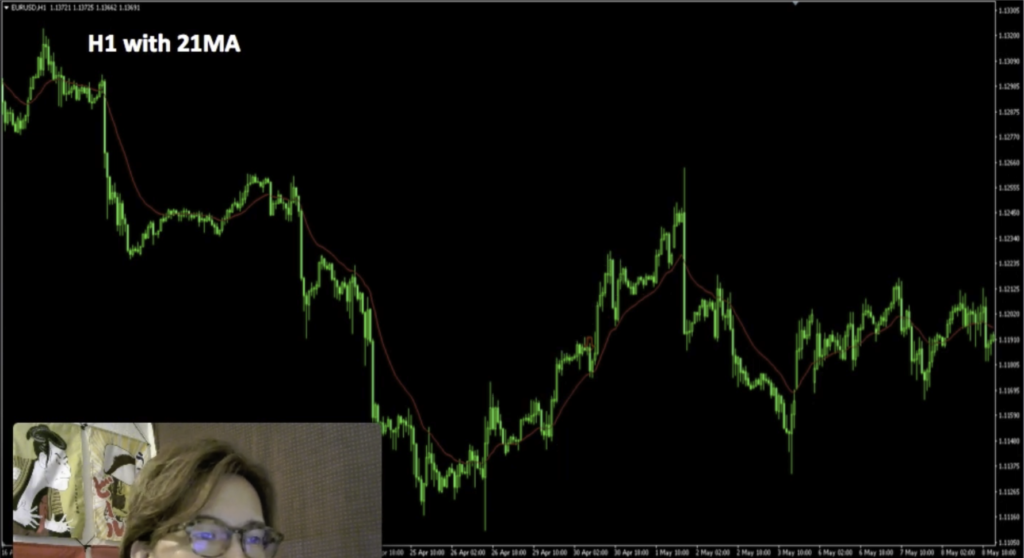
For example, 21MA on H1 chart was working.
And look at the M5 chart with 252 MA.
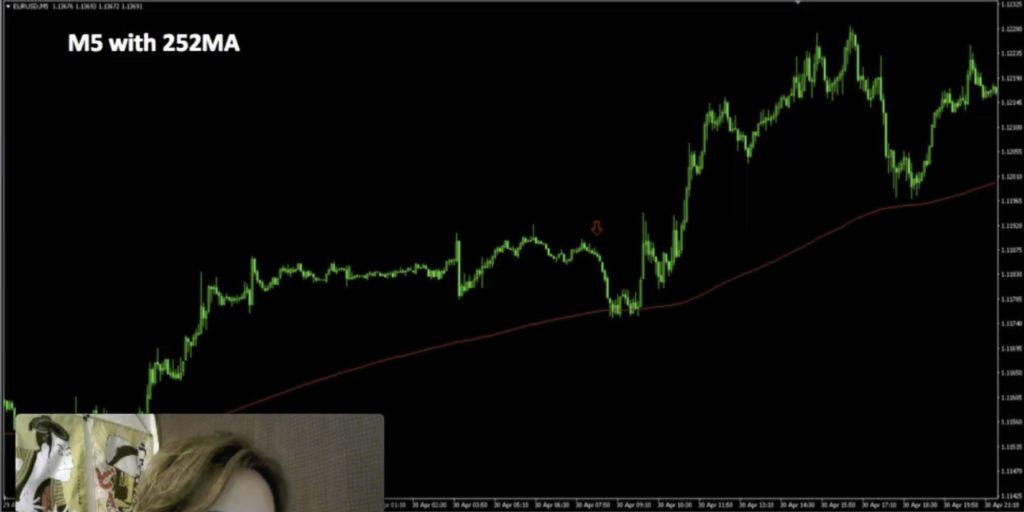
You know why it’s working? Because 252MA in M5 chart is the same as 21MA in H1 chart.
(200MA was located a little above this 252MA)
One thing I want you to remember is that there are MAs that are dead, and there are MAs that are alive.
So identify the MAs that are alive and working on the chart.
But before looking for the indicator that’s working, I highly recommend you to have an ability to analyze the bare and naked chart because lower timeframe chart, like M5 chart is affected by the higher timeframe anyways. So instead of looking for a right indicator, it’s much faster to improve your trading skill by analyzing the chart with resistance, support, and channel lines.
3. Multiple Timeframe Analysis
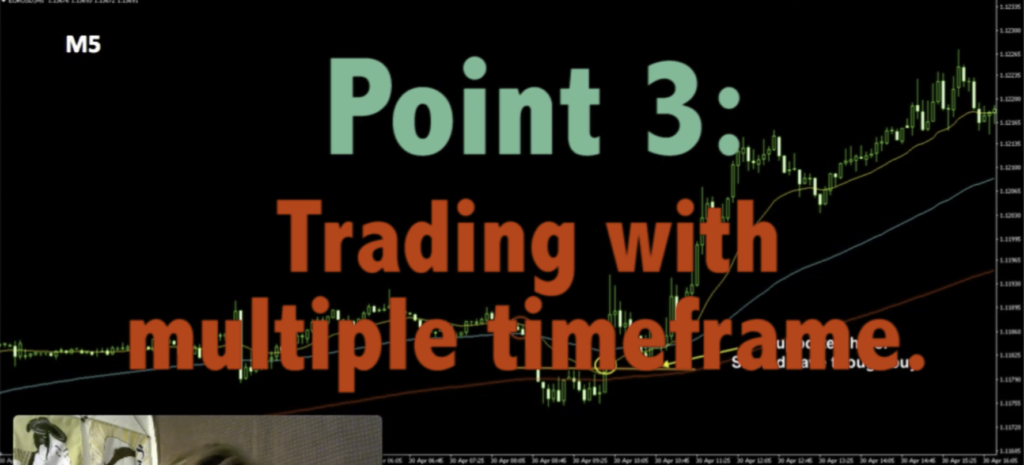
Good thing about Patrick’s trade was that he looked at H4, H1, and M5 chart and created his own scenario and traded.
At times we are too lazy to analyze the chart from Daily, H4, H1… because we want to place orders and make money ASAP!
But if you think like that, I want you to step back, take a deep breath, and look at the chart again.
Trading AGAINST the Cognitive Bias
We all have what we call Cognitive Bias.
And I think one of the answers to be a good trader is to take advantage of this.
Cognitive Bias is like a “convinced self,” when you only see things in a way you see it.
In trading, there are those who foresees the push back, and those who foresees what might happen after the push back.
And the difference is HUGE.
Where the cognitive bias is enforced, there are relatively more loss cut, hence a trend can occur in that place.
If you can think not only how you think, but think how others think, where the others target and where the others place stop loss, then you can trade like a real professional trader!