
This is a live trade on EURGBP on 12/06/2019.
I placed two buy positions and ended up with break even (little profit) and soon after closing the position, the price went straight down.
Loss cut technique is very important because that’s the way to secure your account. And if you can survive from the market, there’s always a next chance. But if you die, that’s the end of the game.
Watch Video
EURGBP Daily chart on 12/06/2019
This trading is recorded on the 12th of June, 2019.
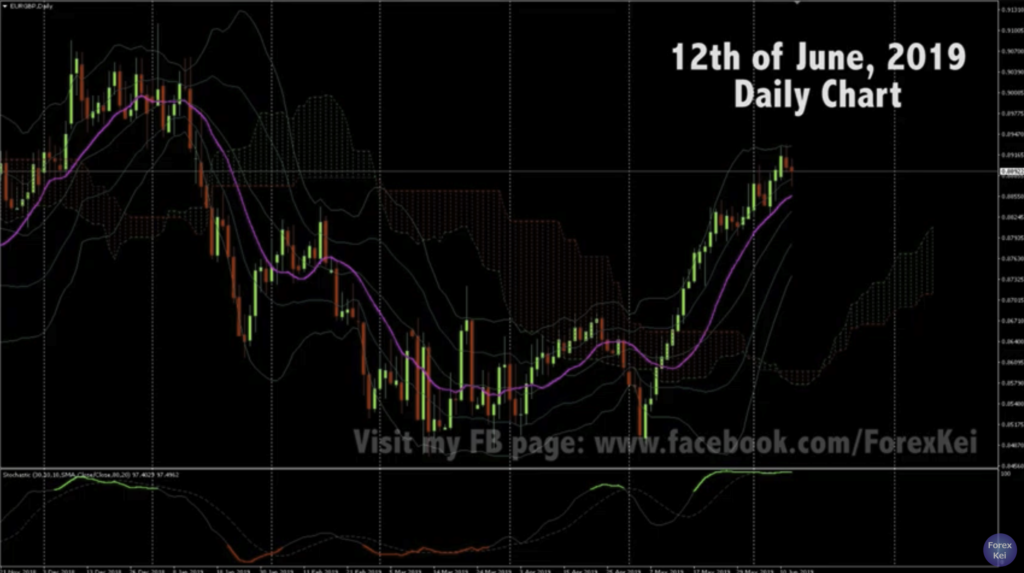
This chart is the Daily chart of EURGBP I am thinking to trade this currency pair because as you can see, it’s been a strong bull trend recently, it’s no doubt.
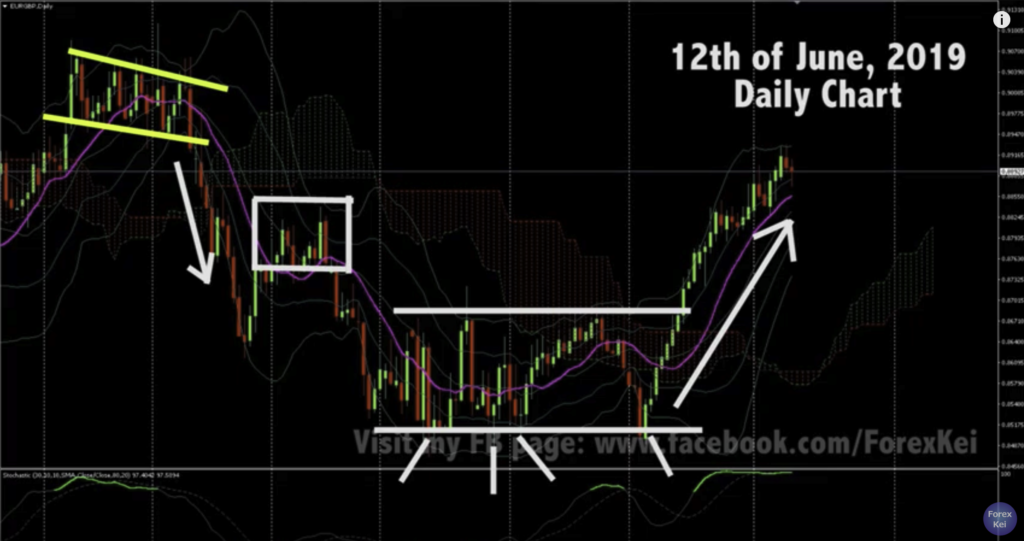
If you look at the price action, the price marked a highest on last December, higher low and lower low chart pattern, then it went straight down, then it moved up and marked double head, then it came down and created range. Now, when you look at the bottom of the chart, it marked the lowest price 3 times, and after the 4th drop, it spiked up and it’s been on bullish momentum since then.
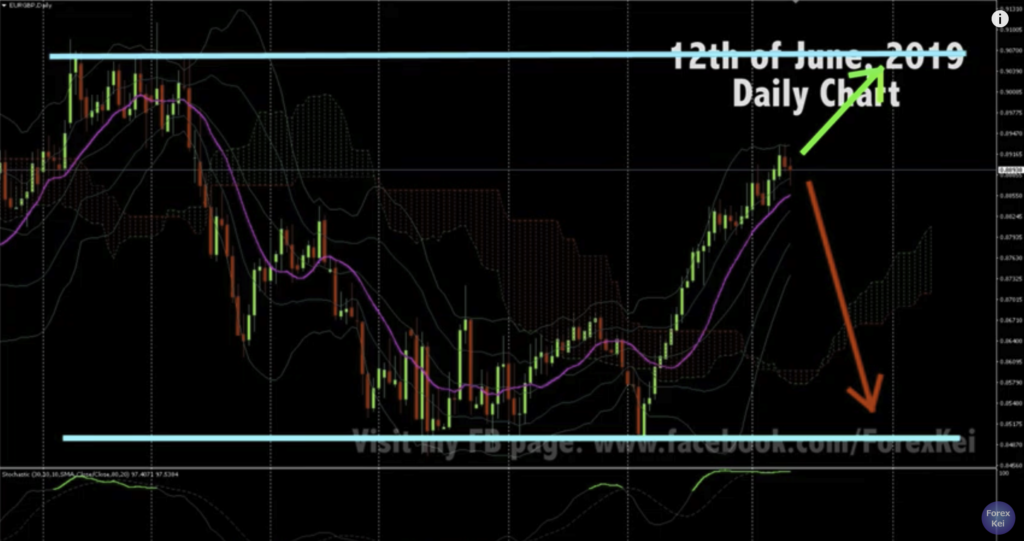
Now, you can say that this is a wide range between the highest and recent lowest prices as shown in blue liens. And if you are a swing trader who holds position for months, then this might not be a good timing because the price kind of in a middle of the range and it could go up to this highest or drop down to the lowest and the risk reward ratio will not gonna be good.
But for day traders like myself who only holds positions for a couple of days, this is a great chance to buy because it’s on a bull trend obviously.
Now, let’s break it down to 1H chart.
1H Chart
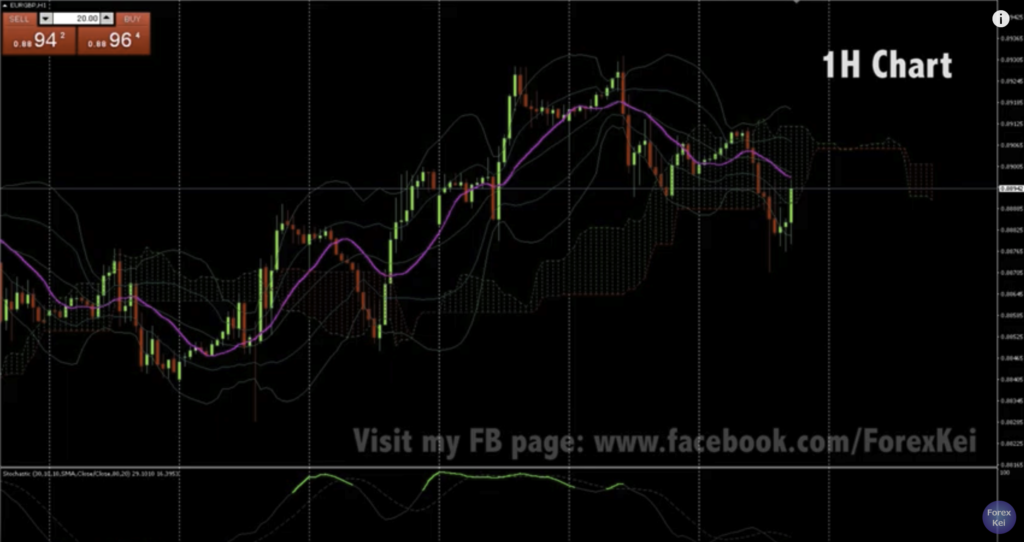
This is 1H chart and it’s also showing bull trend just as Daily chart.
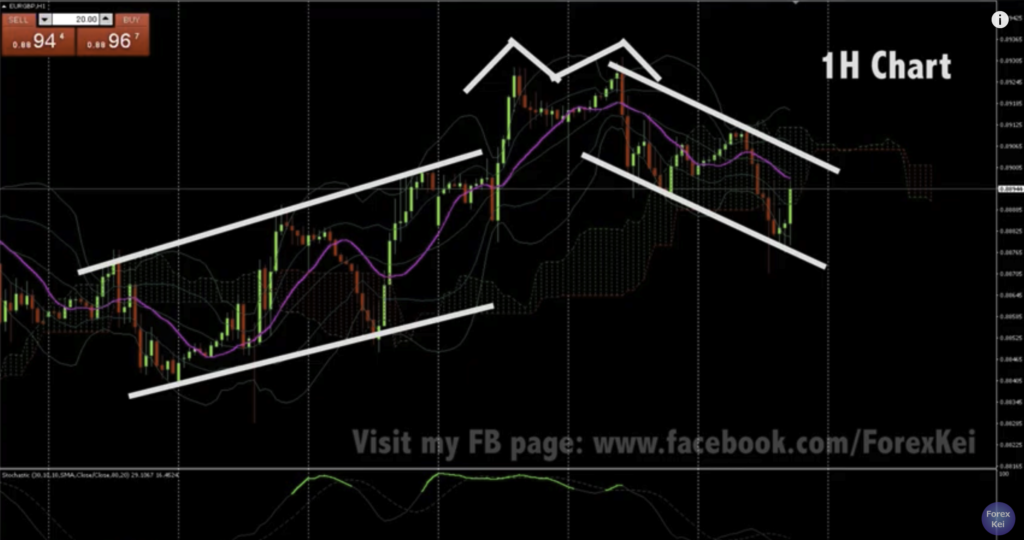
The price action has been continuous lower high, higher high until at the top but look how it’s changing after that. After it created like double top, the price action became higher low and lower low. So Primary trend is still in a bull trend but if you break it down, we can say that it’s currently on a down trend.
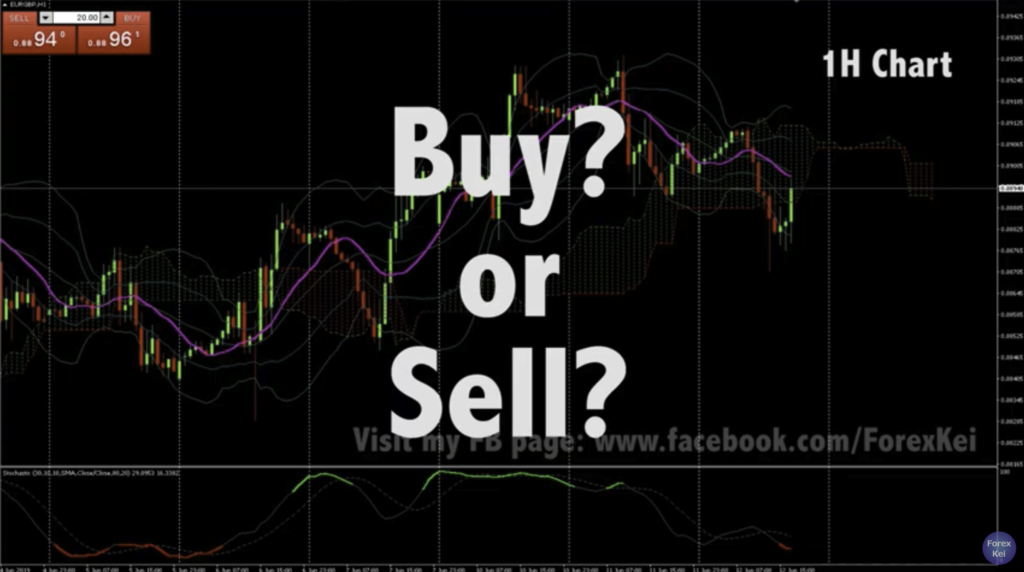
Now, depending on how you look at the chart, there are reasons for buy and reasons for sell in this chart. Think for a moment yourself and try to create a scenario, like what do you think the chart will move from this point? If you think it’s gonna go upwards, what are the reasons? And if you think the price will go downwards, what are your ideas? Think about it for a moment…
Ok, there are reasons that the price could go either direction.
Sell scenario
First, let’s think of a case when the price goes down. If I bring up the reasons, Number 1, the recent price action shows down trend, like lower high, lower low, then along with the price action, if you look at the moving average, the pink line, it’s moving downwards, and the price just broke Ichimoku’s Cloud downwards.
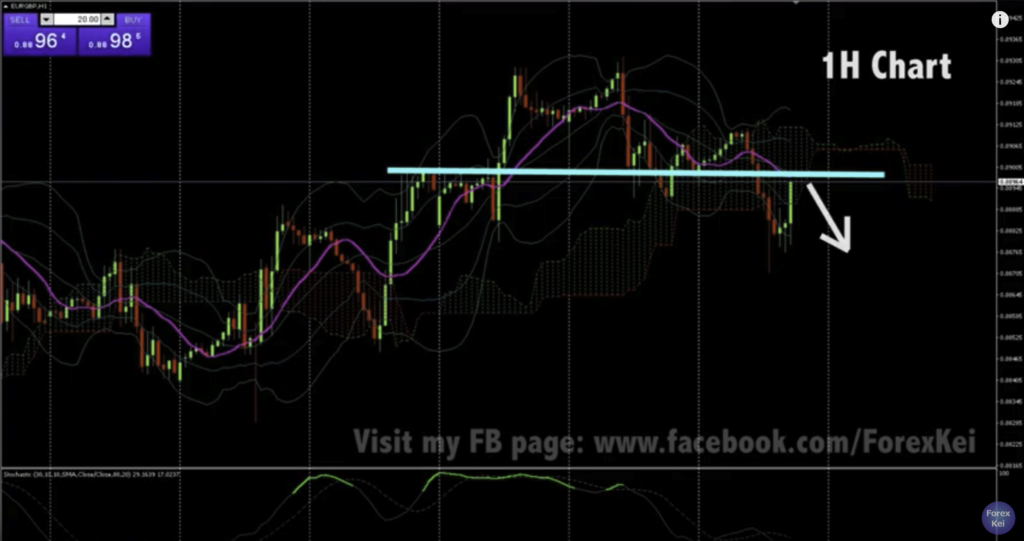
Then Number 2, you can draw a horizontal line here so the price could be resisted here and could go down from the current price, and we never know how far the price could go down.
Buy scenario
Ok, then when you created a scenario of buy, what was your scenario?
First, the primary trend is uptrend and if you see the chart in a longer time frame, it’s still lower high so unless the price breaks the recent lowest, it’s still on a bull trend.
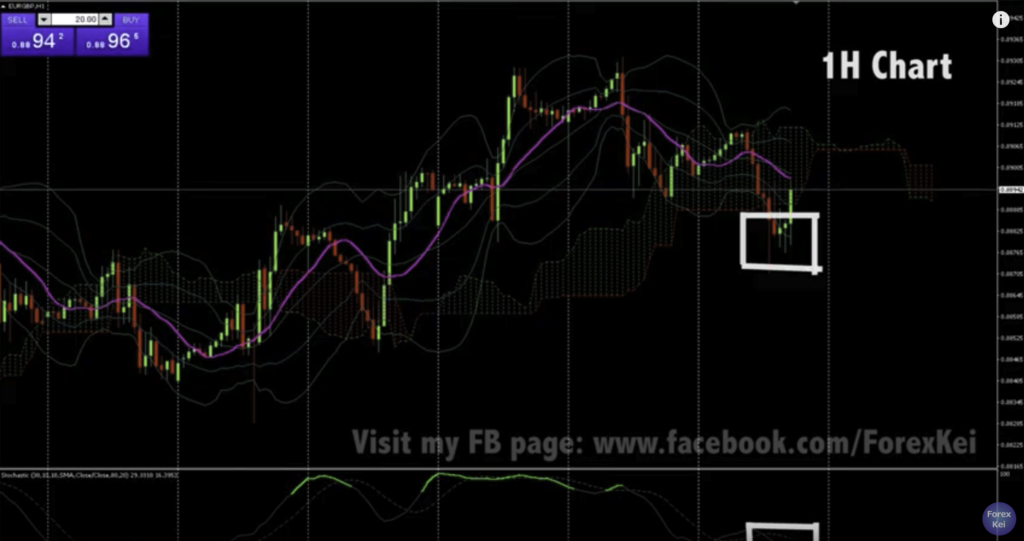
Also, look at the Stochastic. It’s showing oversold signal as it shows in red, and also if you look at the recent candles, their wicks are pointing downwards, right? So that means the price could be supported and could go up from here.
So which one did you think? Buy or sell? As you know, there’s no universally right answer to it. It’s just how you see the chart depending on the timeframe, how long you hold the position, and what tools you use. If you have any other thoughts or ideas, put them into the comment box below.
OK, let’s break it down to 5min chart and see what we can find.
5min chart
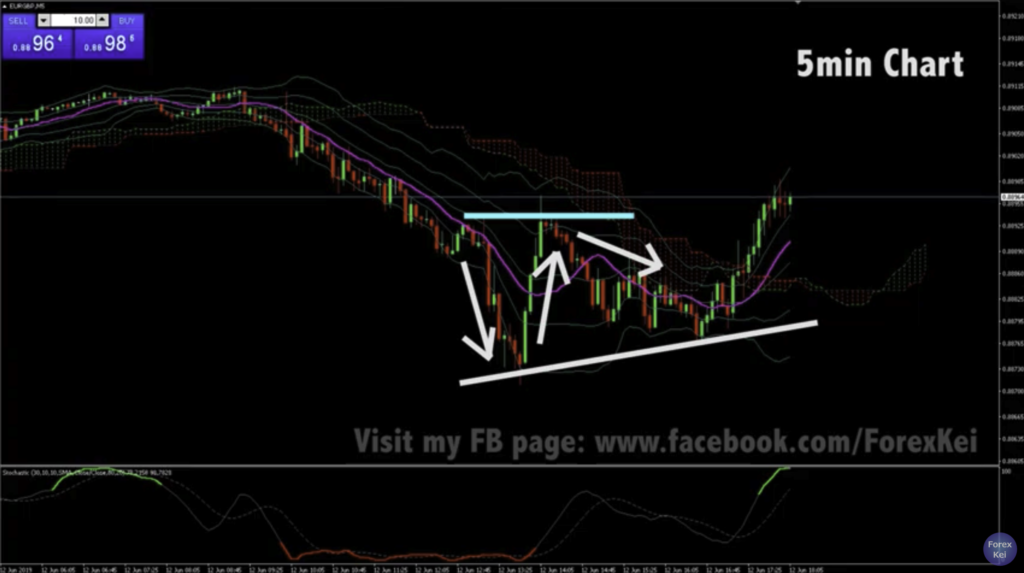
In 5min chart, the price came down all the way, and marked selling climax, then moved up but resisted, then came down but it didn’t go below the recent lowest, marked lower high, then it’s moving up. The price broke Ichimoku Cloud upwards and it could be a sigh of trend reverse and the price could go upwards from here.
However, the Stochastics shows overbought so the price could go down from this point, and could mark lower high and go up, or it breaks the recent lowest downwards and the price continue to go down. We never know.
Placed buy with 10 lots
Anyways, I placed a buy following primary trend with relatively smaller lot, just 10 for now because the price could go back down from here and also the distance to recent lowest is about 30 pips so I will take the risk into consideration.
It could be resisted once and could go up after that. I don’t know. But even the price goes back down, I can take the risk of 30 pips, about $3,900 and aim for the target of 1H chart’s recent high, which is about 100 pips, so the risk to reward becomes 1 to 3 in this case.
We will see…
5min chart 30min later
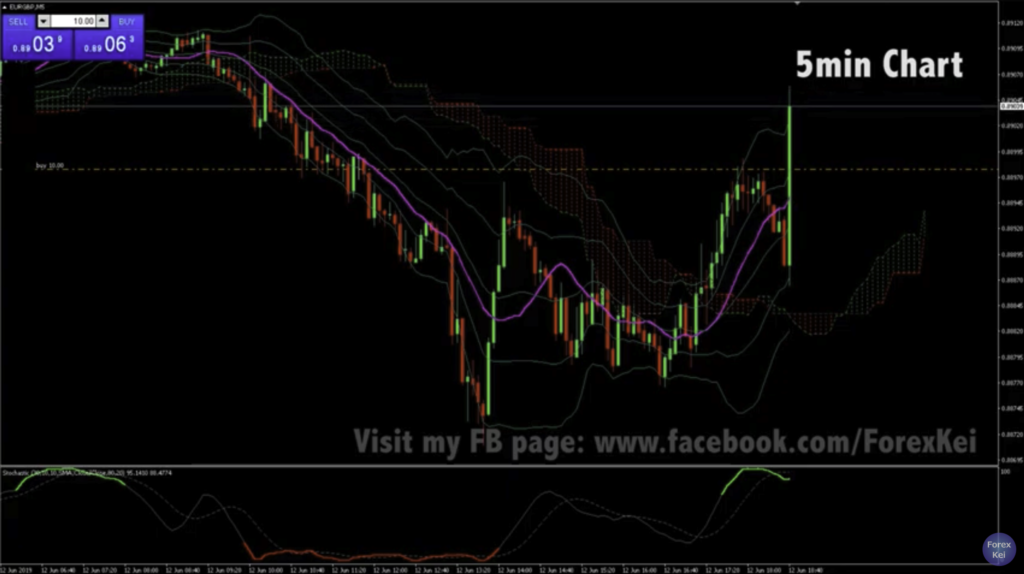
This is like 30min later from the previous recording.
The price just broke upwards and it’s pretty strong. Very strong buy energy here, this must be caused by some fundamental new but… this is too strong. Whenever you see this kind of price action and when it shoots up or shoots down, usually it comes back right down and start to go opposite direction. But in this case… we’ll see.
5min chart 1 hour later
Ok, about 1 hour passed from the previous record.
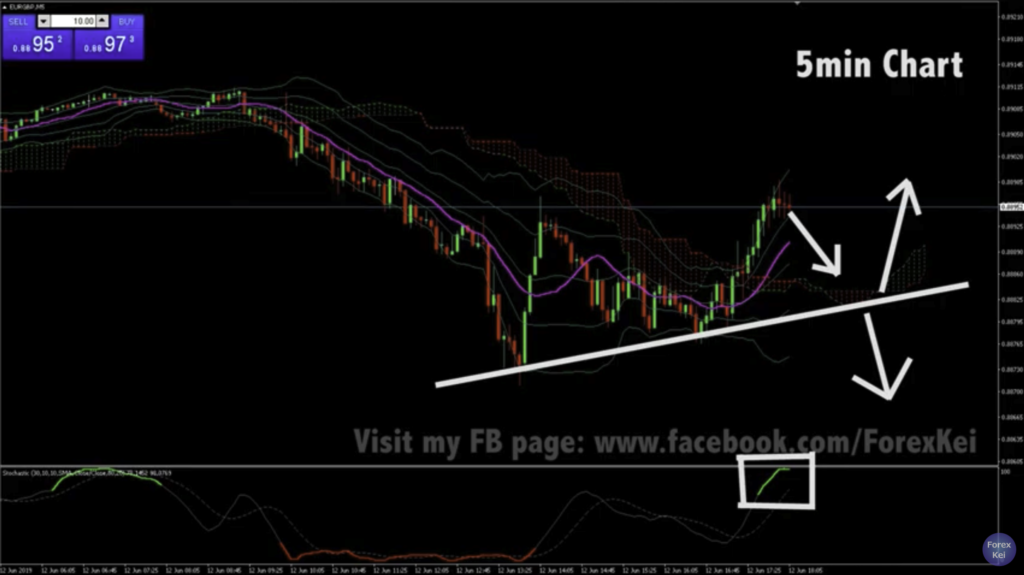
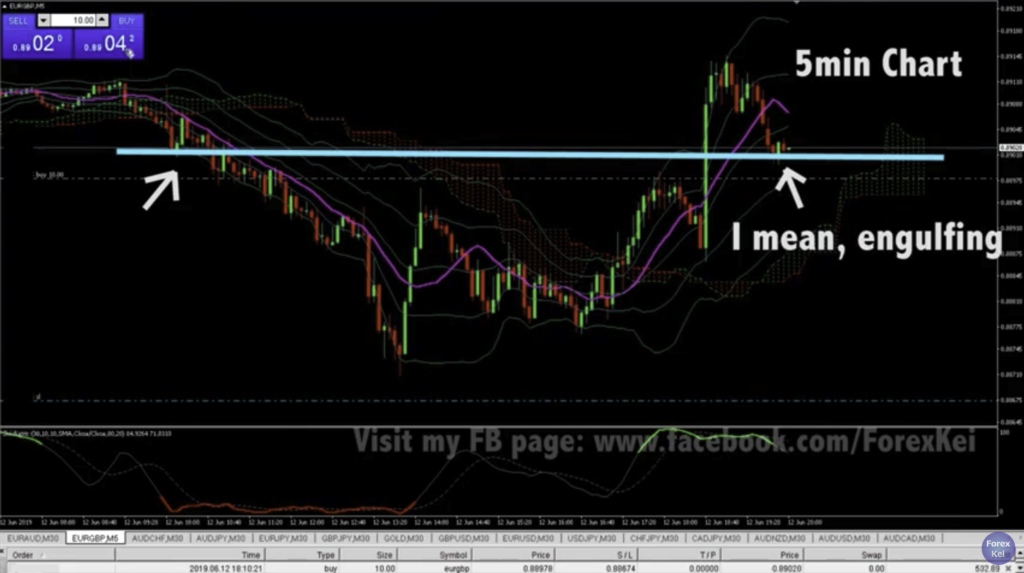
After the spike, the price is coming back down. Look how the price stopped at this bullish candle.
And if I draw a line as on the picture above, it was right at the past dip and the price shows the green engulfing candle pattern. So, I place another buy with 10 lots here because I think it’s a sign of push back, and place the stop loss right below the recent lowest. I expect the price will go up from here but if it goes down, I don’t want to hold the position until the greater lowest, which is at this point, so for this position, I place stop loss here and if it gets cut, it’s ok.
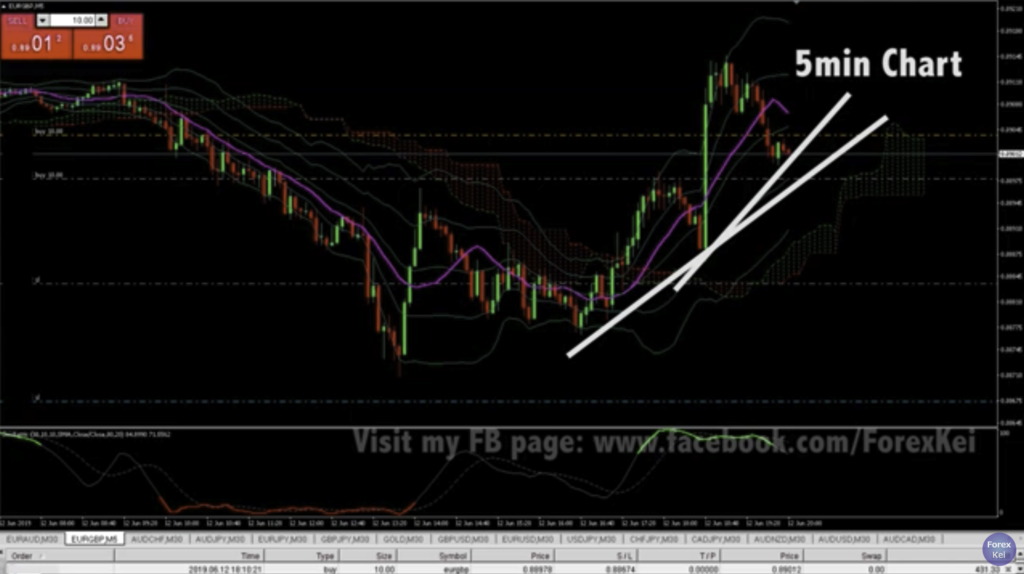
The price has been marking lower highs here, and also, if you draw lines as shown on the picture above, the angle is getting steep, so if the price were to go up from this point, it might be a great spot for continuous bull trend which is a primary trend. We will see.
1H Chart after a while
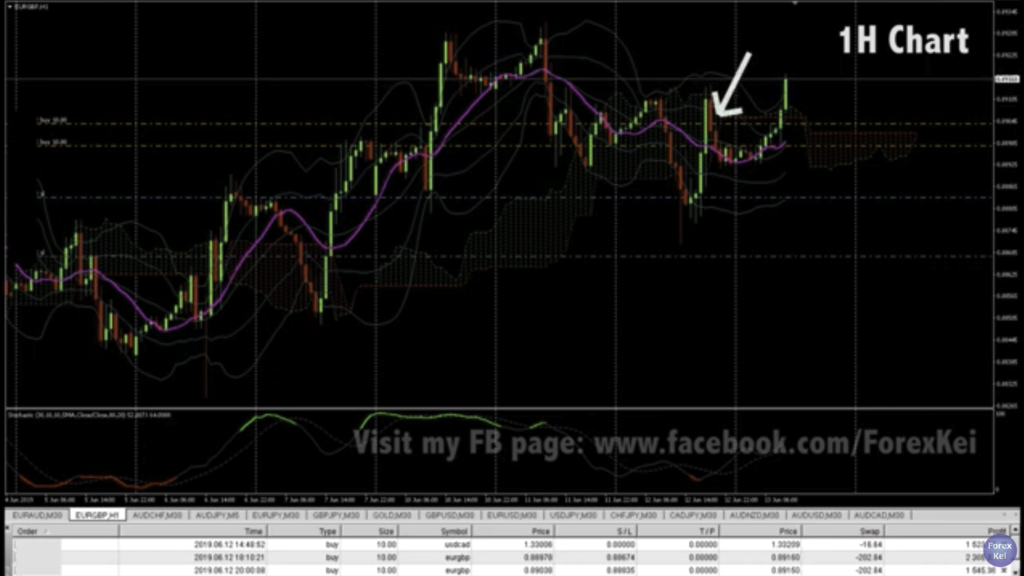
This is 1H chart and after a while, the price kept moving up as you seen above.
In the previous recording, I placed buy at the arrow, and it just kept moving up since then. And the price just broke the recent highest upwards on this 1H chart and heading towards the next target, which is at this level.
So at this moment, I am thinking to move the SL to a little above because it’s clear that the market is on bull trend now. Let’s look at 15min chart and look for a reasonable price level for the stop loss.
15min chart
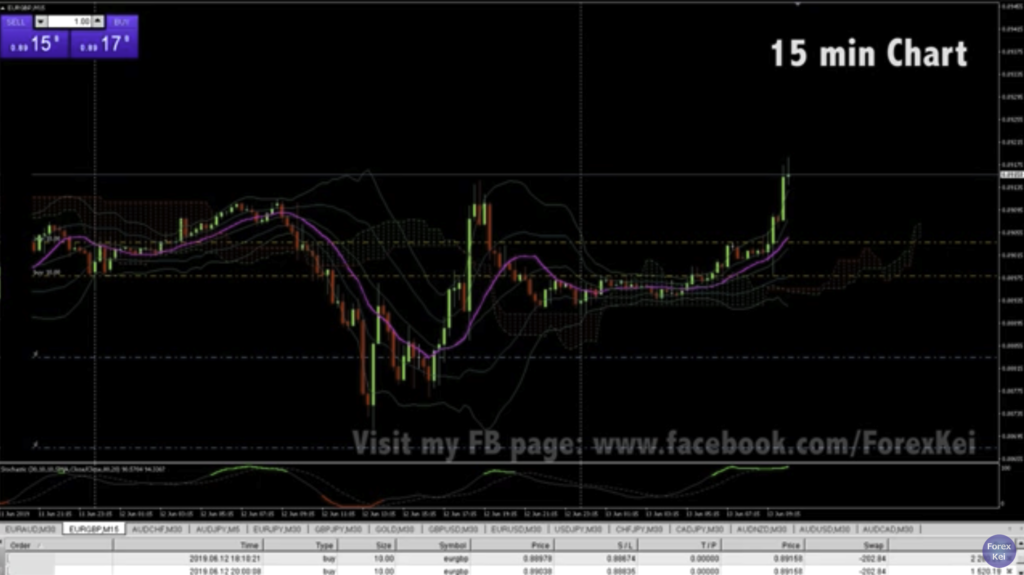
This is the 15min chart. As you just saw on 1H chart, this 15min chart also shows it’s on bull trend and you can see that the price just broke recent highest upwards. And let’s see where I can move the stop loss.
In this chart, the price is moving above like 20 pips from the first position and about 15pips from my second position. This is something to remember but if the stop loss, or the take profit line is too close, then it might touch the line and lose position. Of course, you don’t lose any money if it’s moved right above the entry position, but your winning rate will become low in that case. So it all depends on the volatility and price action basically. So in this case, in this 15min chart, the price is moving up very strong recently and this is too strong, I mean, if it’s too strong like this, it might be going backwards, just as you saw earlier spike on 5min chart, and creates a dip, then the up trend may continue.
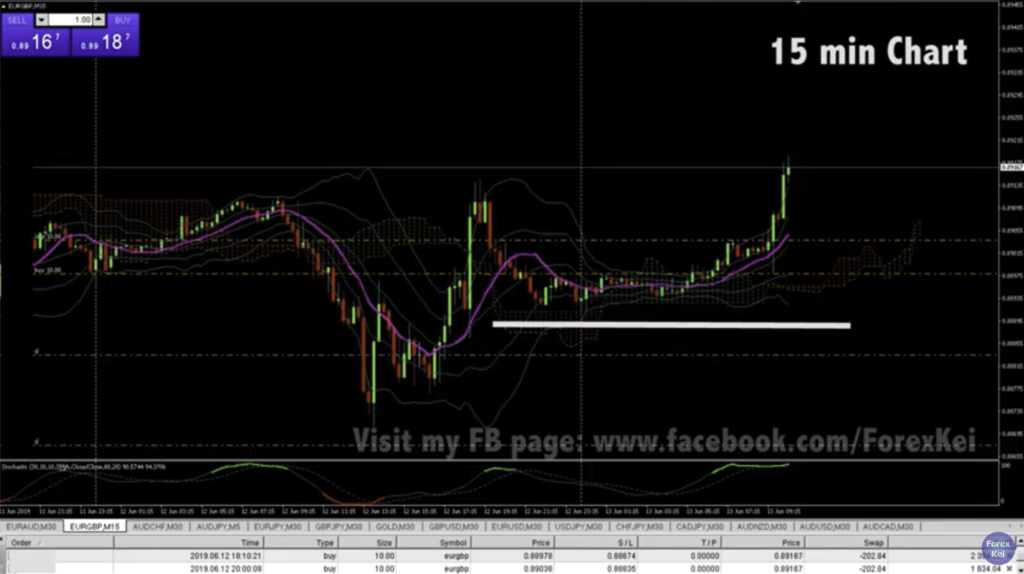
So, with that being said, I will move both stop loss to the recent lowest, which is at the level highlighted in white line. You know, you don’t wanna lose any money so it’s necessary to move the stop loss to your position after you confirm the price is going up, but the timing is very important. You cannot just look at a chart and say, “oh it’s moving up so let’ move the stop loss!” No.
You better wait and see how the price will move, whether it marks push back, supported somewhere, and goes up or not, otherwise, it could be a bad break-even because you lose that position and your winning rate will be dropped.
So it’s your call whether you choose break even or wait until you confirm the price action. Maybe you have to go out for any reasons like dinner or meeting friends or whatever and cannot look at a chart real time, and in that case, you could move the stop loss to the position with only like 20 pips or so away from the current price.
But anyways, always keep in mind, that when you have the position with some profit, it’s already an advantage, and you don’t wanna lose the opportunity so easily.
OK, let’s see how it turns out.
5min chart few hours later
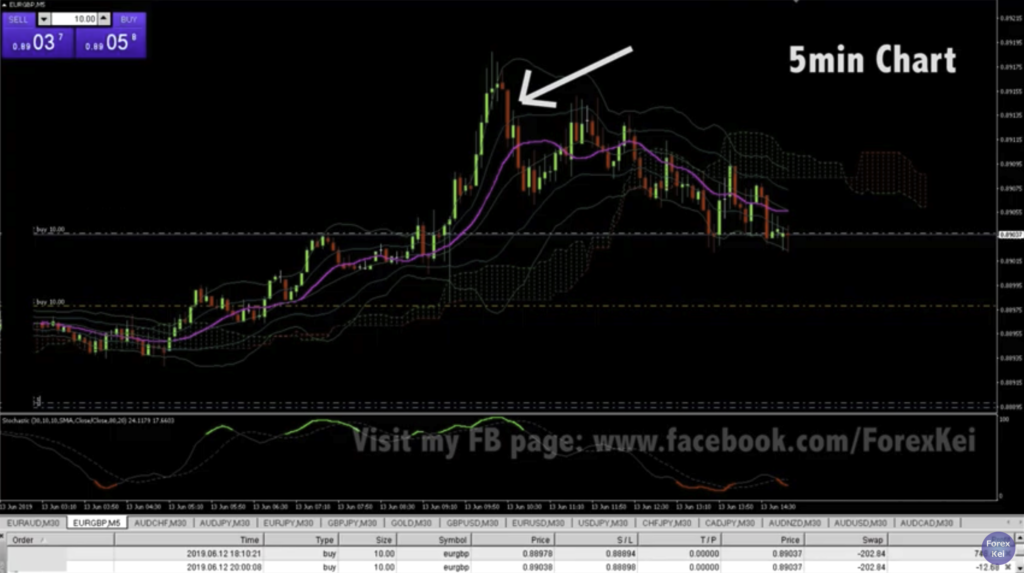
OK, few hours have passed and the price is coming back down now. This is 5min chart and I was recording the video at where the arrow shows. But the price has been coming back down now.
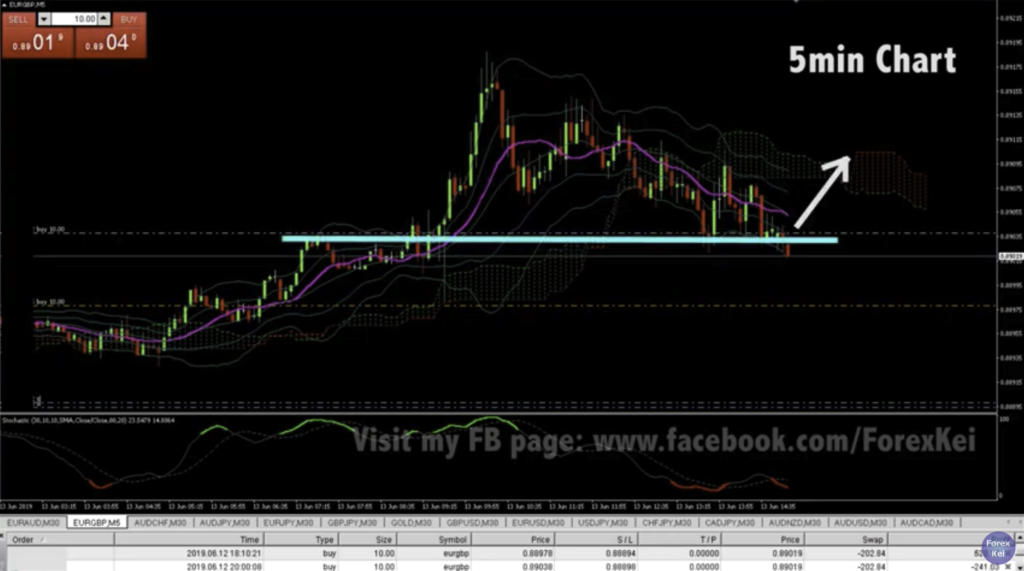
The down trend is pretty steady, marking higher low, lower low. And looks like the price could be supported at the blue line and go up but this is like the last stand. If the price breaks this line downwards, then I will cut the loss.
And if you watch the video, the tick movement shows it’s pushing downwards, not like pushing up the ceiling, so it might break downwards. The energy downwards is pretty strong.
The profit between two positions were just like break even, or slightly on profit like few dollars.
Cut loss with small profit (almost break even)
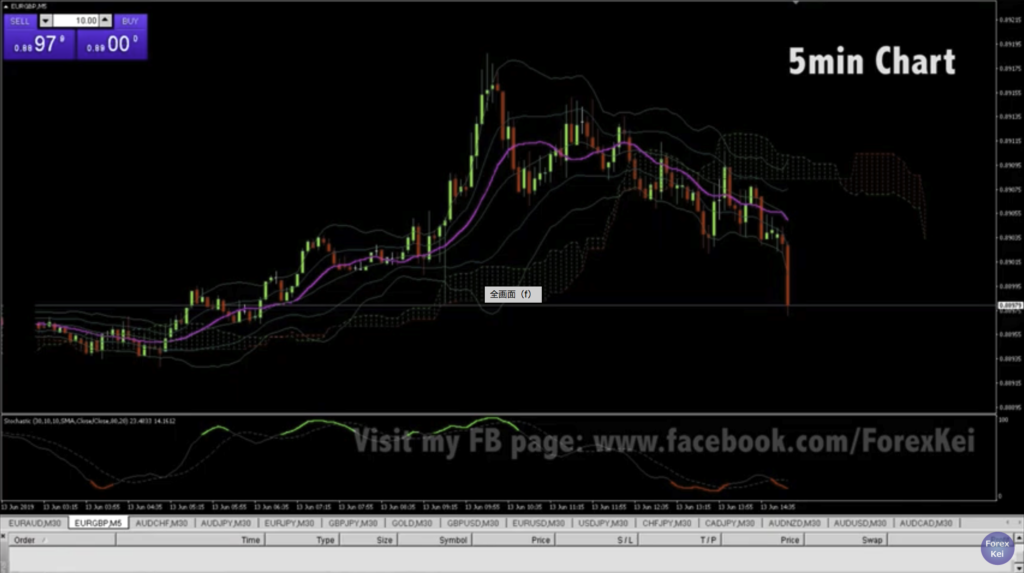
So I cut the loss. Then, the price just keeps going downwards as soon as I cut the loss, went almost like 10 pips drop in a second so If I was holding the position, I was getting like $1,000 loss. So I have to say it was a right loss cut.
So, whenever you see the chart real time, especially in this kind of 5min or 1min chart, if you look at the smaller time frame and look for the chance to place orders or cut loss, take profit, one thing you can look at is the tick movement.
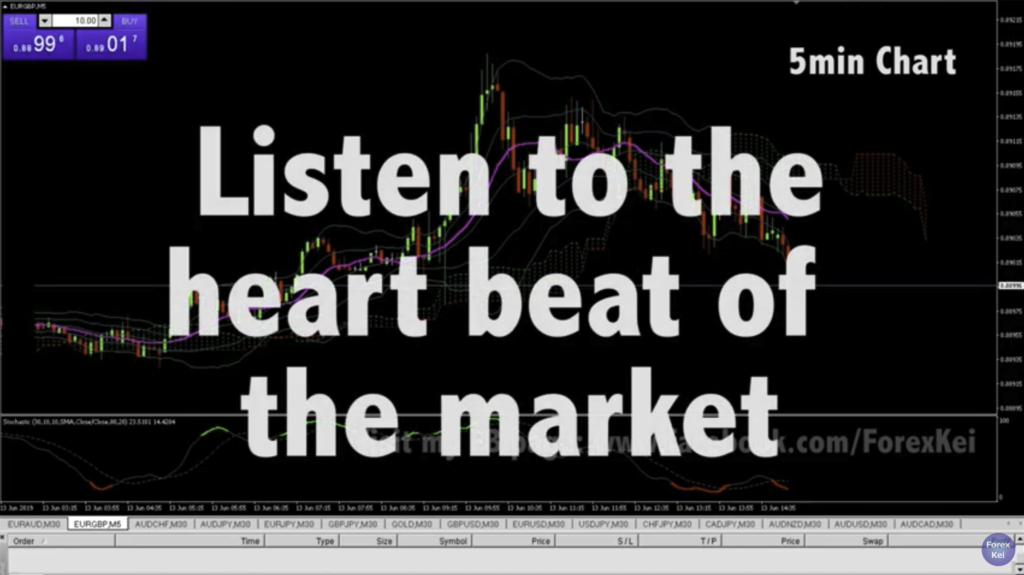
I call this the heart beat of the market. The price was just hitting the ground downwards many times before it breaks downwards. If you watch the chart real time and if you try to get the timing, you can listen to the heart beat of the price action in lower time frame so that you know which direction the market wants to move in a short term. Sometimes I listen to the heartbeat during some economic news, like employment change or FOMC, like when those big news happens, you can see the price move actively and you can really feel the heartbeat of the market.
After a while, the price is even further down. Glad that I cut the position already. Like I said on my previous video, I believe surviving from the market is more important than winning. Survive first, then you can talk about winning. If you cannot survive, and if you lose your bullets, you cannot keep fighting. So, it’s always better to end the game with at least break even because there are chances everyday.
Alright, that will be it for today’s video. I’m going out to take my dog for a walk now. And after that, I will record another LIVE video on USDCAD and GBPJPY because I am making profits on those currency pairs now. I will put the link on below so please check it out, too.
Cheers,
Kei